
XRP is trading at $2.02 at press time, with a 24-hour volume of $4 billion. The price has declined by almost 2% over the last 24 hours and 9% in the past week.
However, multiple technical signals across different timeframes suggest that buyers may be gaining strength. Traders and analysts are watching for possible confirmation of a shift in trend.
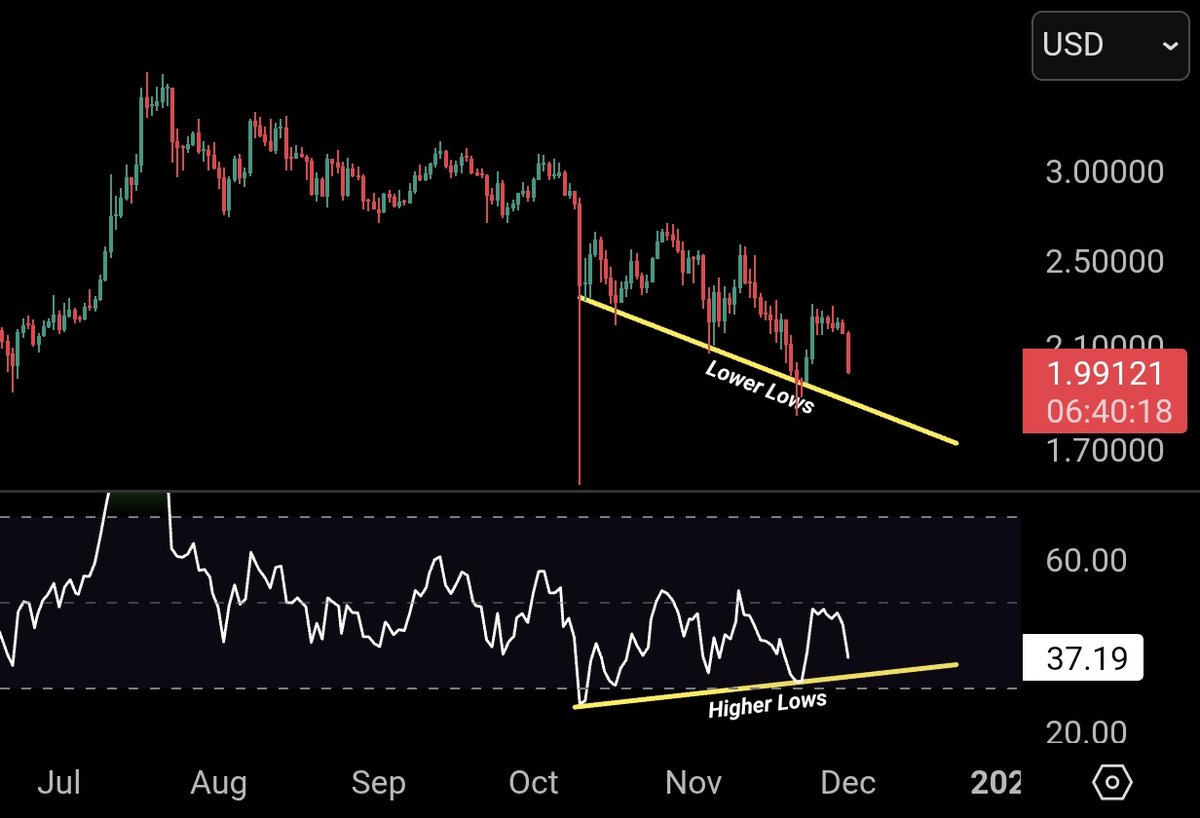
Bullish Divergence Appears on Daily Chart
XRP has been in a gradual downtrend for over 55 days following a sharp liquidation event. During this time, the asset has continued to make lower lows. However, the Relative Strength Index (RSI) on the daily chart is forming higher lows, indicating a potential bullish divergence. This pattern is often seen as an early sign that downward momentum is weakening.
According to technical analyst ChartNerd,
“The longer it takes, the stronger the signal gets.”
Notably, the RSI currently sits at 37 and remains below the neutral zone. ChartNerd stated that this setup would remain valid unless the RSI forms lower lows in line with falling prices. If that happens, the current divergence may be considered invalid, and bearish momentum could resume.
Long-Term Support Holding Near $1.75
XRP has maintained its position above the monthly closing high from the 2018 bull market. This level, near $1.75, has held as a support zone for over a year. Despite market volatility, XRP has not broken below this line on a monthly closing basis.
CryptoBull said on X that this level remaining intact means the cycle may still be in progress.
“This is NOT the top,” he wrote.
He added that a cycle top usually includes a large monthly candle with high volume, which XRP has not yet shown. The price action remains above the key support area as volume levels stay moderate.
Technical Patterns Show Strengthening Setup
EGRAG CRYPTO pointed to a possible bullish pennant forming on the monthly XRP/BTC chart. He noted that XRP is now trading above its 50-month EMA, which acted as strong resistance during 2021.
“This is a major market structure shift,” he said.
His outlook includes a 60–70% chance of a breakout in the next 3–6 months, depending on market conditions.
At the same time, ChartNerd’s Wyckoff reaccumulation analysis places XRP near the lower end of a longer-term range. Short-term liquidity maps also suggest price interest between $2.10 and $2.15, according to STEPH IS CRYPTO, who noted that XRP may attempt to move toward that area.
The post XRP Holds Critical Support as Analysts Prepare For Another Rally appeared first on CryptoPotato.
XRP shows bullish divergence after a 55-day downtrend as analysts track key support, potential breakout levels, and whale accumulation. Crypto Bits, Crypto News, Ripple (XRP) Price
This articles is written by : Nermeen Nabil Khear Abdelmalak
All rights reserved to : USAGOLDMIES . www.usagoldmines.com
You can Enjoy surfing our website categories and read more content in many fields you may like .
Why USAGoldMines ?
USAGoldMines is a comprehensive website offering the latest in financial, crypto, and technical news. With specialized sections for each category, it provides readers with up-to-date market insights, investment trends, and technological advancements, making it a valuable resource for investors and enthusiasts in the fast-paced financial world.