TLDR
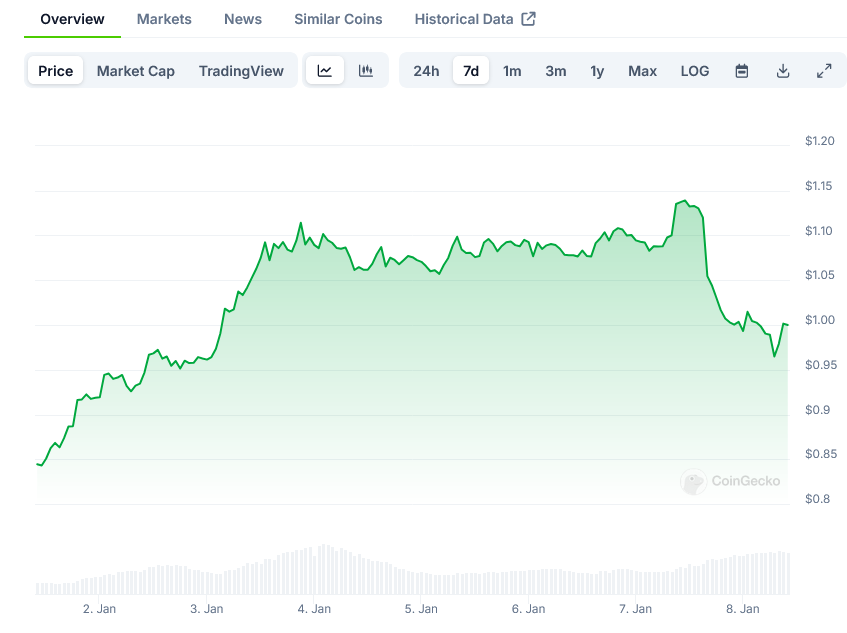
- Cardano (ADA) broke above key moving averages and reached $1.11 on January 3, 2025, after bouncing from December low of $0.76
- Current trading price is $1.089, with price action showing resistance at the $1.11 level
- Technical analysis indicates an uptrend with moving average lines trending higher
- Key resistance levels are at $1.11 and $1.32, with potential for reaching previous high of $2.33 if broken
- Short-term outlook suggests sideways movement unless price breaks above $1.11 or falls below moving averages
Cardano (ADA) has shown renewed strength in early January 2025, reaching $1.11 on January 3rd after a sustained recovery from December lows. The digital asset, currently trading at $1.089, has maintained its position above key moving averages, suggesting continued bullish momentum.
The recovery began on December 20, 2024, when buyers stepped in at the $0.76 price level, establishing what appears to be a local bottom. Since then, the cryptocurrency has demonstrated consistent upward movement, breaking through several technical resistance levels.
Market data indicates that buyers have remained active in the market, pushing the price above both short-term and long-term moving averages. This technical achievement represents an important milestone for Cardano’s price action, as these moving averages often serve as key indicators for market participants.
The current price structure shows clear support from the 21-day Simple Moving Average (SMA) on the 4-hour timeframe. This technical indicator has proven reliable during the recent upward movement, providing a foundation for further price advancement.
Traders and investors are closely watching the $1.11 price level, which has emerged as a crucial resistance point. This level has already rejected the price once during the January 3rd attempt, leading to the current consolidation phase.
Above the current trading range, the market has established clear resistance levels at $1.20, $1.30, and $1.40. These price points represent potential areas where selling pressure may intensify as the asset attempts to continue its upward trajectory.
On the support side, the market structure shows strong buying interest at $0.90, $0.80, and $0.70. These levels align with previous areas of price reaction and could serve as bouncing points should any retracement occur.
The 4-hour chart analysis reveals that Cardano‘s price action has maintained its position above the 21-day SMA, suggesting healthy short-term momentum. However, traders should note that a break below this moving average could trigger a deeper price correction.

Looking at the daily timeframe, the moving average lines have shifted into an upward trend, providing additional confirmation of the broader bullish market structure. This technical alignment supports the case for continued upward movement, pending the break of key resistance levels.
The next major hurdle for Cardano lies at the $1.32 resistance level. A successful breach of this price point could open the path toward the previous high of $2.33, though such a move would require sustained buying pressure and favorable market conditions.
Trading volume patterns indicate steady participation from market participants, with increased activity observed during key breakout attempts. This volume profile supports the validity of the recent price movements.
The market’s reaction to the $1.11 resistance level has forced the asset into a period of consolidation. This phase typically resolves either with a breakout above resistance or a retracement to test lower support levels.
For the upward trend to continue, buyers need to demonstrate enough strength to push through the $1.11 barrier. Failure to do so could result in extended sideways movement or a potential retest of lower support levels.
Current price data shows Cardano trading at $1.089, maintaining its position above key moving averages while market participants await the next decisive move. The asset continues to show resilience above the December lows, suggesting underlying buying interest remains intact.
Trading between the established support at $0.90 and resistance at $1.11, Cardano’s price action indicates a clear battle between buyers and sellers at these crucial levels.
The post Cardano (ADA) Price: Demonstrates Strength with 46% Recovery from December Lows appeared first on Blockonomi.
This articles is written by : Nermeen Nabil Khear Abdelmalak
All rights reserved to : USAGOLDMIES . www.usagoldmines.com
You can Enjoy surfing our website categories and read more content in many fields you may like .
Why USAGoldMines ?
USAGoldMines is a comprehensive website offering the latest in financial, crypto, and technical news. With specialized sections for each category, it provides readers with up-to-date market insights, investment trends, and technological advancements, making it a valuable resource for investors and enthusiasts in the fast-paced financial world.