TLDR
- XRP has tested the $2.50 resistance level four times in the past week while maintaining support above $2.32, showing persistent bullish pressure despite short-term range-bound trading
- Trading volume data indicates overall higher buying pressure in recent months, though momentum has slowed in the past two weeks
- Two major liquidation clusters have formed near $2.26 and $2.54, marking key price levels that could trigger significant market movements
- Technical indicators show a bullish trend line forming with support at $2.38, with the price trading above the 100-hour Simple Moving Average
- The cryptocurrency has successfully defended the 78.6% retracement level, suggesting a potential uptrend if price breaks above the $2.50-$2.70 range
XRP’s price action has shown remarkable stability in recent trading sessions, maintaining support above $2.32 while repeatedly testing the crucial $2.50 resistance level. Over the past week, the digital asset has made four distinct attempts to breach this key price point, demonstrating persistent buying pressure despite short-term consolidation.
The cryptocurrency’s recent price movements have established a clear trading range between $2.30 and $2.50, with notable volume clusters forming at these boundaries. This range-bound activity comes after a volatile start to February, where trading volumes reached elevated levels.
Technical analysis of the daily chart reveals an interesting development in buying pressure. The On-Balance Volume (OBV) indicator has maintained an upward trajectory over recent months, though this momentum has experienced a slight deceleration during the past two weeks. This subtle shift in volume patterns provides valuable insight into the current market structure.
In the four-hour timeframe, price action has formed a distinct pattern, with a key bullish trend line emerging at the $2.38 level. The asset currently trades above both this trend line and the 100-hour Simple Moving Average, suggesting underlying strength in the current market structure.
Liquidation data has revealed two notable clusters forming just outside the current trading range. These clusters, positioned at $2.26 and $2.54, represent potential trigger points for increased volatility. Traders are closely monitoring these levels as they could catalyze the next major price movement.
The market has demonstrated particular interest in the $2.420 price point, which has served as an intermediate support level within the established range. This level coincides with the 50% Fibonacci retracement of the recent downward movement from $2.5241 to $2.3353.

Short-term price action indicates the formation of a base above $2.32, with buyers stepping in consistently at this level. This behavior suggests an accumulation phase may be underway, as market participants position themselves for potential future price movements.
The Relative Strength Index (RSI) on the daily chart currently sits below the neutral 50 mark, indicating room for potential upward movement should buying pressure increase. This technical indicator aligns with the overall market structure, suggesting possible upside potential.
Recent price data shows XRP has successfully defended the 78.6% retracement level, a technically important achievement that could support further upward movement. This defense of a key technical level adds weight to the bullish case for the asset.
Trading Analysis
Trading volume analysis reveals an interesting pattern of higher overall buying pressure over recent months. However, current volume levels remain subdued compared to the heightened activity observed in early February, suggesting a period of consolidation.
The hourly chart demonstrates the formation of a bullish trend line, providing additional technical support for the current price structure. This trend line, combined with other technical indicators, suggests the potential for continued upward momentum.
Market participants are particularly focused on the $2.50-$2.70 range as a key area for potential breakthrough. A decisive move above this zone could signal the beginning of a new uptrend for the digital asset.
The MACD indicator on the hourly timeframe shows increasing momentum in the bullish zone, providing additional technical confirmation of the current market structure. This technical signal adds to the growing body of evidence supporting potential upward movement.
From a support perspective, the price has established multiple defensive positions. Beyond the immediate support at $2.420, additional backing exists at $2.380, coinciding with the aforementioned trend line. Should these levels fail, the $2.320 support zone represents the next major defensive position.
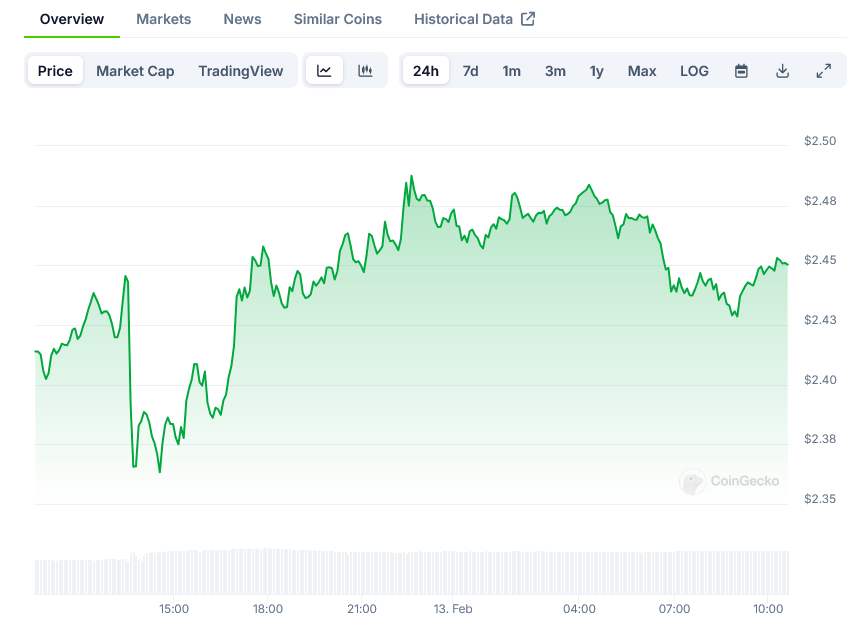
The most recent price action shows XRP trading at $2.43, maintaining its position above key support levels while continuing to probe resistance at $2.50. Trading volume remains steady, with market participants closely monitoring for signs of a potential breakout.
The post XRP Price: Shows Promise as Trading Volume Supports Bull Case Above $2.32 appeared first on Blockonomi.
This articles is written by : Nermeen Nabil Khear Abdelmalak
All rights reserved to : USAGOLDMIES . www.usagoldmines.com
You can Enjoy surfing our website categories and read more content in many fields you may like .
Why USAGoldMines ?
USAGoldMines is a comprehensive website offering the latest in financial, crypto, and technical news. With specialized sections for each category, it provides readers with up-to-date market insights, investment trends, and technological advancements, making it a valuable resource for investors and enthusiasts in the fast-paced financial world.