TLDR
- Solana has broken above the $175 resistance level, converting it to support
- SOL has gained nearly 12% over the past week, trading at $180.37
- A cup-and-handle pattern suggests a potential breakout toward $260-$300
- Rising trading volume ($6.56 billion, up 13.55%) signals increasing market interest
- Technical analysts point to Fibonacci targets at $219 and $245 as next key levels
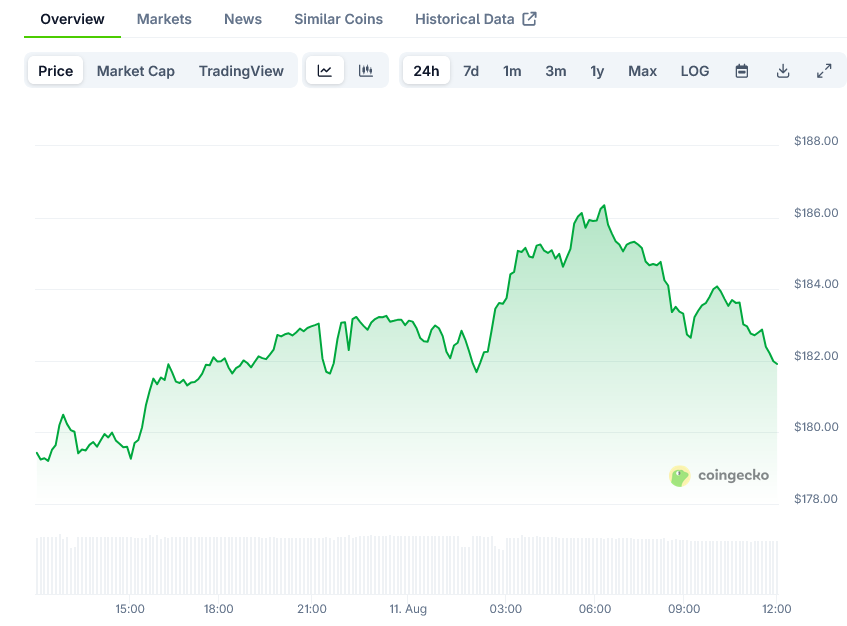
Solana (SOL) is showing strong bullish momentum in the crypto market, breaking through key resistance levels and positioning itself for potential further gains. The cryptocurrency is currently trading at $180.37, having gained 11.94% over the past week while maintaining steady prices in the last 24 hours.
The token has successfully broken above the critical $175 resistance zone, which analysts now believe has been converted into a solid support level. This technical breakthrough comes as SOL’s 24-hour trading volume reaches $6.56 billion, representing a 13.55% increase from the previous day.
Solana’s market capitalization now stands at $97.29 billion, firmly establishing it as one of the top-performing digital assets this month. The weekly chart displays a pattern of higher lows, indicating renewed buying interest following a months-long correction from late-2024 highs.
Market analyst WebTrend suggests that this bullish configuration points toward a $300 target, with intermediate resistance around $275. This represents approximately 66% upside potential from current price levels.
$SOL is next, free money.
Save this post. pic.twitter.com/Wkltp8VszJ
— WebTrend (@WebTrendCo) August 9, 2025
For the bullish case to remain intact, maintaining support above the newly established $175 level is crucial. A secondary support at $160 could help limit potential downside, while a decisive move above $200 might trigger an accelerated rally toward higher targets.
Derivatives Market Signals
The derivatives market data further supports the positive outlook for Solana. According to CoinGlass, derivatives trading volume has increased by 5.19% to $25.09 billion, while open interest has climbed 1.43% to $10.04 billion.
The open interest-weighted funding rate stands at 0.0011%, indicating a balanced sentiment with a slight bullish tilt among traders. These metrics suggest growing participation in the Solana ecosystem as the token approaches recent highs with increasing momentum.
Historical price patterns indicate that if current market conditions persist, SOL could be poised for another strong upward move in the near term. The combination of price action, volume increases, and derivatives market data all point toward continued strength.
Several analysts have highlighted a multi-year cup-and-handle pattern forming on Solana’s chart. This widely recognized bullish formation shows a well-defined structure stretching back to 2021, with the neckline resistance positioned just below the $260 zone.
Currently, SOL is moving within the handle formation, gradually edging higher toward this key breakout level. A decisive move above the neckline on strong volume could trigger a substantial macro rally.
Fibonacci Targets and Short Squeeze Potential
Technical analysis points to important Fibonacci retracement levels as the next targets for Solana. The 61.8% retracement level at $219 acts as the immediate checkpoint, followed by the 75% retracement level at $245.

The $185 level currently serves as immediate resistance, with a cluster of short positions potentially sitting just above this price point. A clean break through $185 could trigger a short squeeze, forcing sellers to buy back at higher prices and adding momentum to the upside.
Adding to this narrative, reports indicate that a large whale trader who shorted SOL and other cryptocurrencies is sitting on unrealized losses exceeding $190 million. If key resistance levels give way, forced covers from such large positions could act as a secondary momentum driver.
The technical pathway aligns with the higher-timeframe cup-and-handle breakout scenario. Once Solana clears $219, the market could see an acceleration toward $245, placing it closer to the macro neckline at $260.
With the long-term cup-and-handle formation nearing completion and key Fibonacci targets in sight, Solana appears positioned for a potential macro breakout. Clearing the $185 resistance could align short-term bullish pressure with the larger multi-year setup.
The path higher depends on momentum holding and support levels staying intact during pullbacks. If the current structure remains unbroken, SOL’s next move could mark a transition from months of consolidation to a decisive trend expansion.
SOL’s price is now testing the crucial $185 resistance zone, with market participants watching closely for a breakout that could pave the way toward higher targets at $219, $245, and potentially the $300 level identified by several analysts.
The post Solana (SOL) Price: Breaking $175 Resistance Level with $300 Target in Sight appeared first on Blockonomi.
This articles is written by : Nermeen Nabil Khear Abdelmalak
All rights reserved to : USAGOLDMIES . www.usagoldmines.com
You can Enjoy surfing our website categories and read more content in many fields you may like .
Why USAGoldMines ?
USAGoldMines is a comprehensive website offering the latest in financial, crypto, and technical news. With specialized sections for each category, it provides readers with up-to-date market insights, investment trends, and technological advancements, making it a valuable resource for investors and enthusiasts in the fast-paced financial world.