Ethereum remains in a broader corrective phase, trading below key moving averages and inside a well-defined descending structure. While short-term stabilization is visible near support, the higher-timeframe trend still favors sellers unless major resistance levels are reclaimed with strong momentum.
Ethereum Price Analysis: The Daily Chart
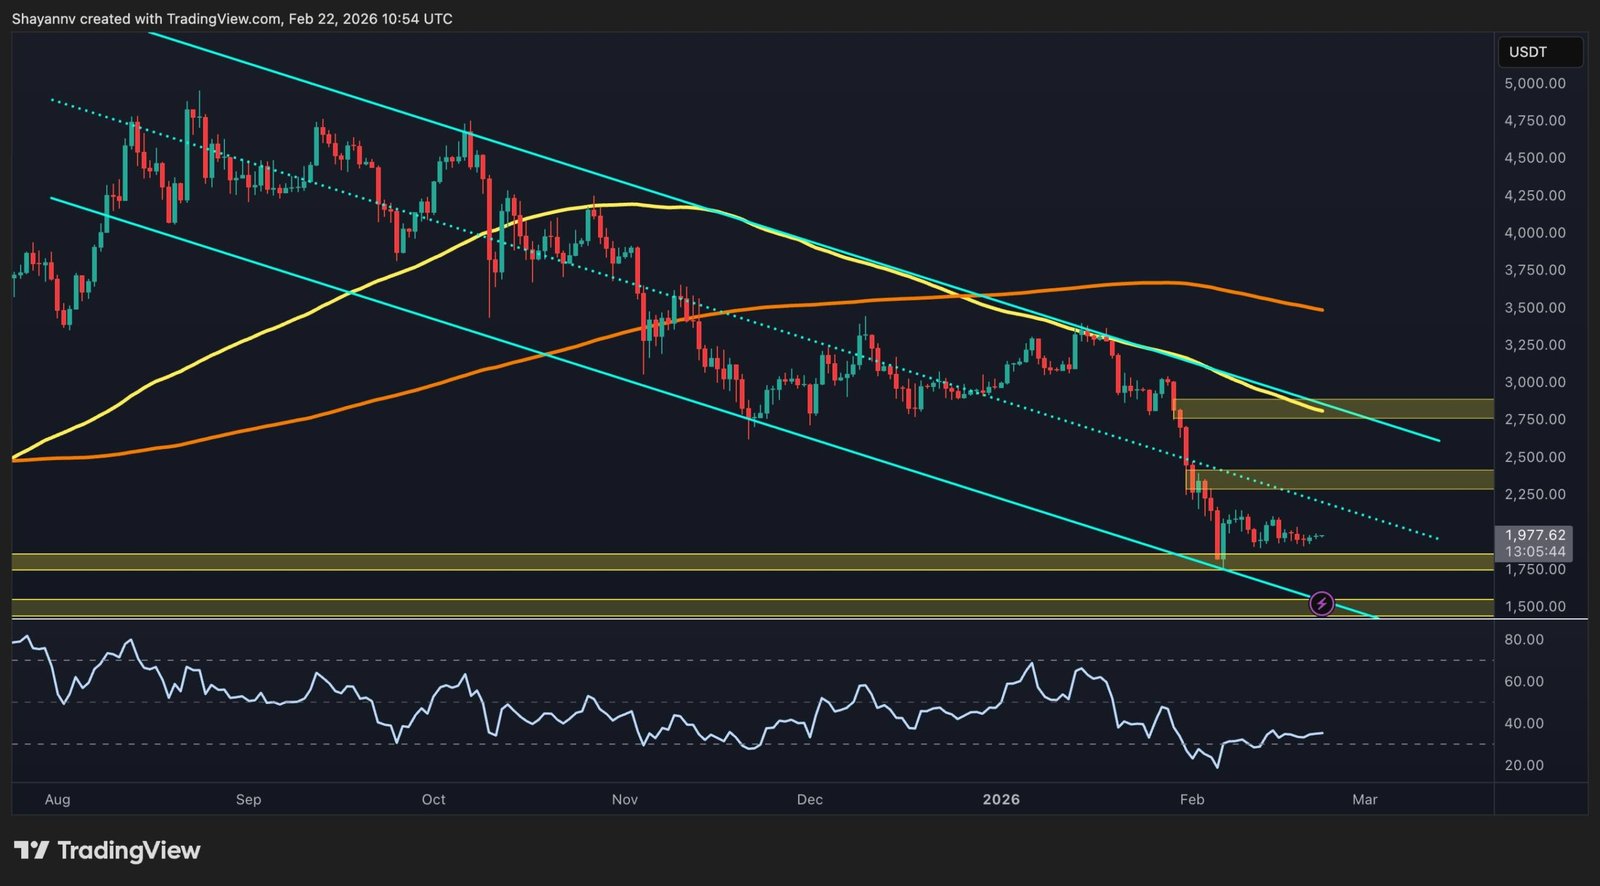
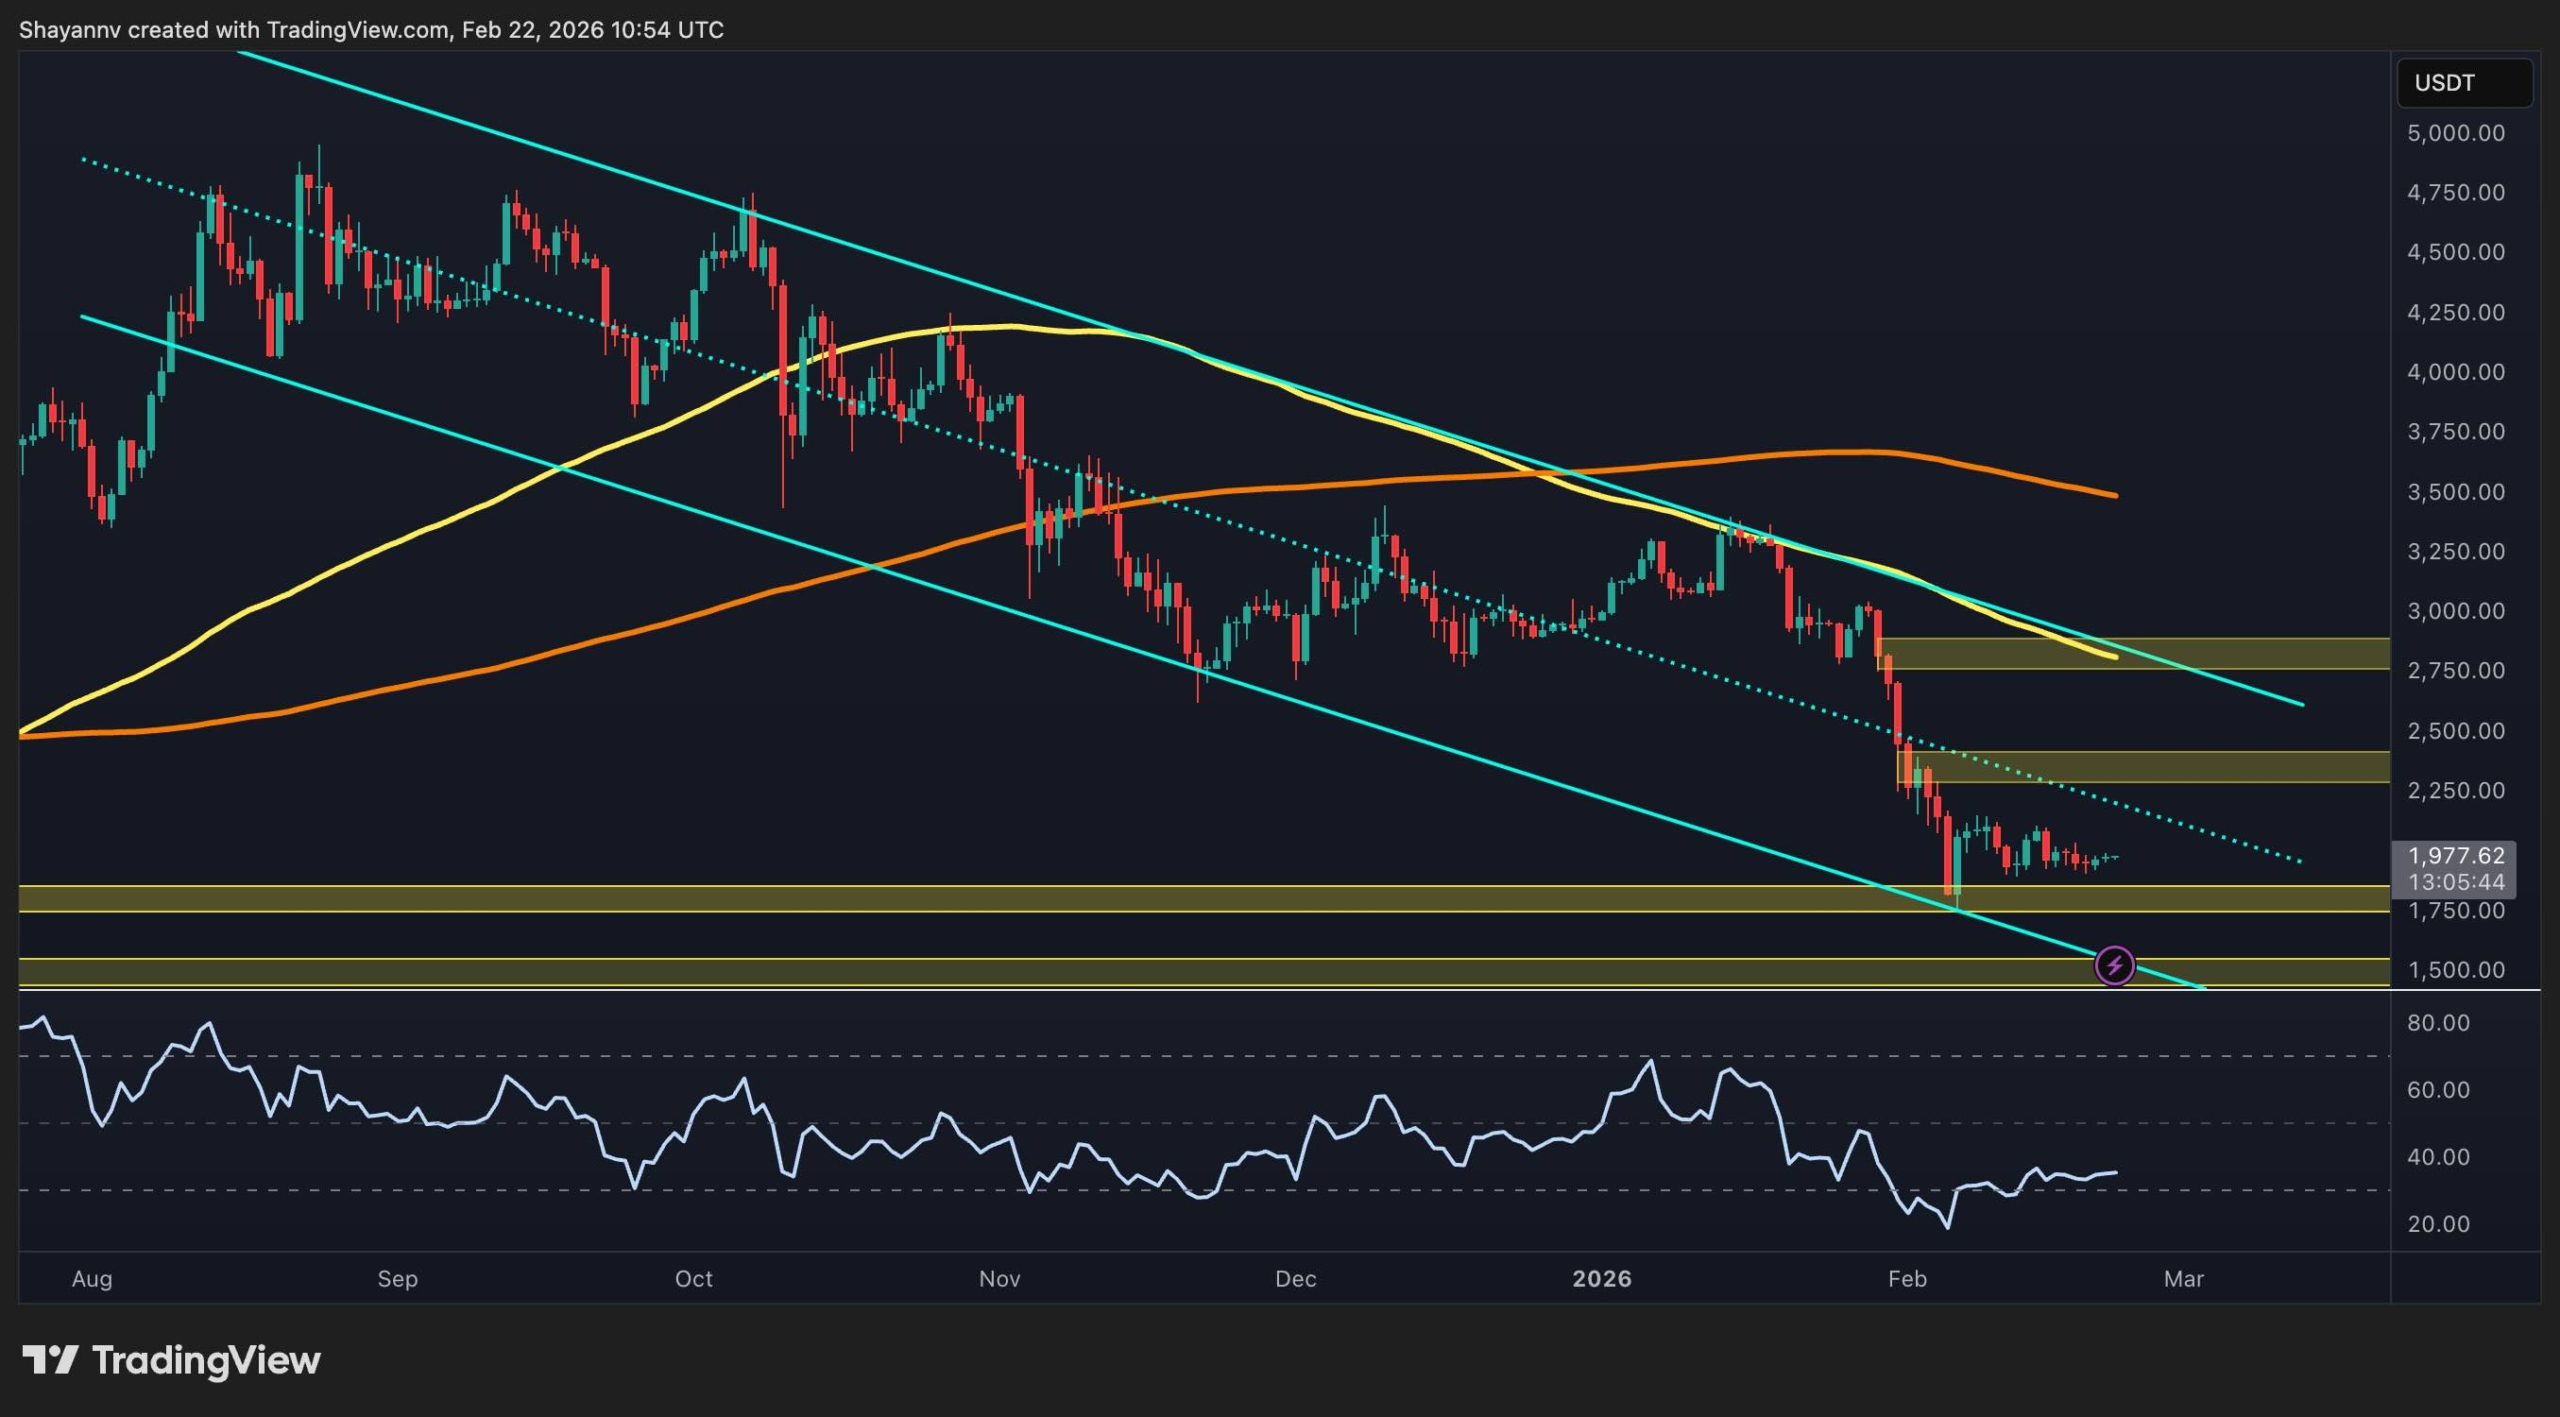
On the daily timeframe, ETH continues to respect a descending channel, consistently forming lower highs beneath both the 100-day and 200-day moving averages. The recent breakdown accelerated the price into the $1,750–$1,800 demand zone, where buyers have stepped in to slow the decline, but the structure remains bearish overall.
The $2,300–$2,400 region now acts as a key resistance cluster, aligning with prior breakdown levels and just below the declining 100-day moving average. Unless ETH can reclaim that zone and break above the channel’s upper boundary, rallies are likely to be corrective, with the risk of another leg toward lower channel support still present.
ETH/USDT 4-Hour Chart
On the 4H timeframe, the asset has been compressing inside a symmetrical triangle formed from recent lower highs and higher lows, above the $1,800 horizontal support zone. This short-term symmetrical contraction reflects indecision rather than confirmed reversal, as lower highs are still being printed.
A breakout above $2,000–$2,100 highs would be the first signal of a short-term momentum shift and could open a move toward the $2,300-$2,400 resistance band. Conversely, losing the $1,800 base would invalidate the consolidation thesis and likely trigger renewed downside pressure toward deeper support levels.

On-Chain Analysis
Active address data shows a sharp spike in network activity recently, with the 30-day EMA of active addresses surging to multi-month highs. Historically, similar expansions in activity have coincided with periods of heightened volatility and often precede major directional moves.
However, despite the spike in participation, the asset has not yet confirmed a bullish reversal. This divergence suggests that while engagement is rising, capital flows are not decisively pushing prices higher, and might be indicating panic selling at lows by weaker hands. If elevated activity sustains while the price stabilizes, it could form a constructive base. However, a confirmation would require a clear break above key technical resistance levels.

The post Ethereum Price Analysis: Vital Support or Value Trap? Decoding ETH’s Next Big Move appeared first on CryptoPotato.
Ethereum remains in a broader corrective phase, trading below key moving averages and inside a well-defined descending structure. While short-term stabilization is visible near support, the higher-timeframe trend still favors sellers unless major resistance levels are reclaimed with strong momentum. Ethereum Price Analysis: The Daily Chart On the daily timeframe, ETH continues to respect a Crypto News, ETH Analysis, Ethereum (ETH) Price
This articles is written by : Nermeen Nabil Khear Abdelmalak
All rights reserved to : USAGOLDMIES . www.usagoldmines.com
You can Enjoy surfing our website categories and read more content in many fields you may like .
Why USAGoldMines ?
USAGoldMines is a comprehensive website offering the latest in financial, crypto, and technical news. With specialized sections for each category, it provides readers with up-to-date market insights, investment trends, and technological advancements, making it a valuable resource for investors and enthusiasts in the fast-paced financial world.