
Key takeaways:
- Our SUI price prediction indicates a high of $2.07 by the end of 2026.
- In 2028, SUI will range between $10.47 and $12.10, with an average price of $10.83.
- In 2031, it will range between $33.01 and $40.39, with an average price of $34.20.
Is SUI a good investment? Will it go up? Where will it be in five years? Our SUI price prediction answers these questions and more.
Overview
| Cryptocurrency | Sui |
| Symbol | SUI |
| Current SUI price | $1.14 |
| 24-hour trading volume | $700M |
| Circulating supply | 4B |
| All-time high | $5.35 on Jan 6, 2025 |
| All-time low | $0.3643 on Oct 19, 2023 |
| 24-hour high | $1.23 |
| 24-hour low | $1.15 |
SUI price prediction: Technical analysis
| Metric | Value |
| Volatility (30-day variation) | 10.99% (Very High) |
| 50-day SMA | $0.9571 |
| 200-day EMA | $1.32 |
| Sentiment | Bearish |
| Green days | 15/30 (50%) |
| Fear and Greed Index | 34 (Fear) |
SUI price analysis
On May 15, SUI coin fell by 4.25% over the past 24 hours and rose by 22.60% over the past 30 days. Its trading volume rose 3.78% to $700M in 24 hours, signaling high conviction in the market trend.
SUI 1-day chart analysis
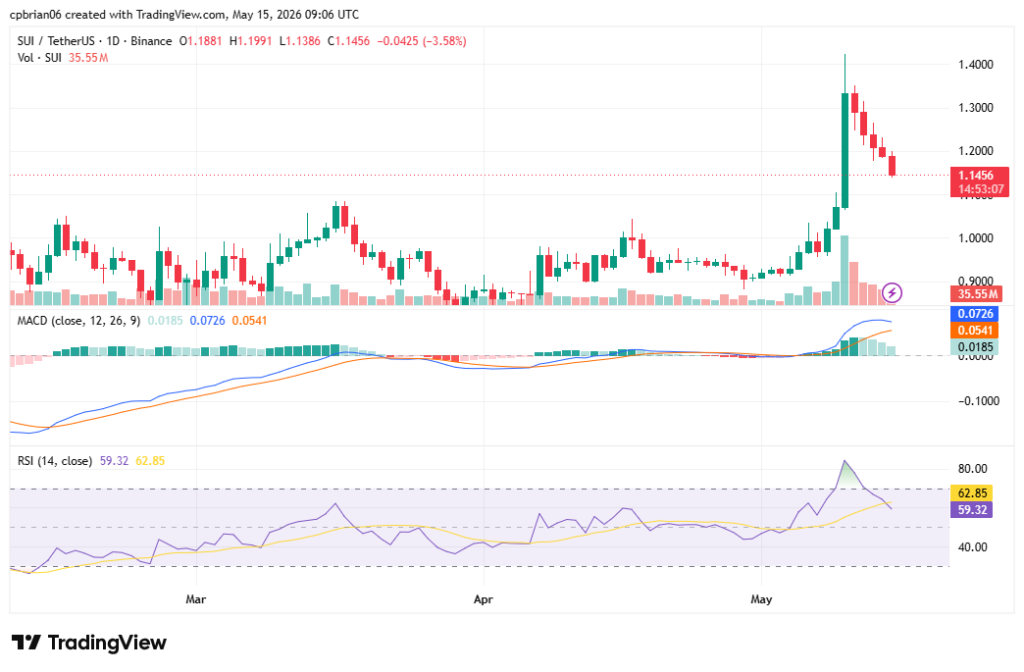
SUI has been bearish this year, having faced resistance at $1.95. The drop pushed the coin below $1.50 and major moving averages in January. In February, it fell below $1.00. This month, it surged by more than 50% in a few days into overbought territory. SUI is now moving downwards as it reverses from overbought territory.
SUI 4-hour chart analysis
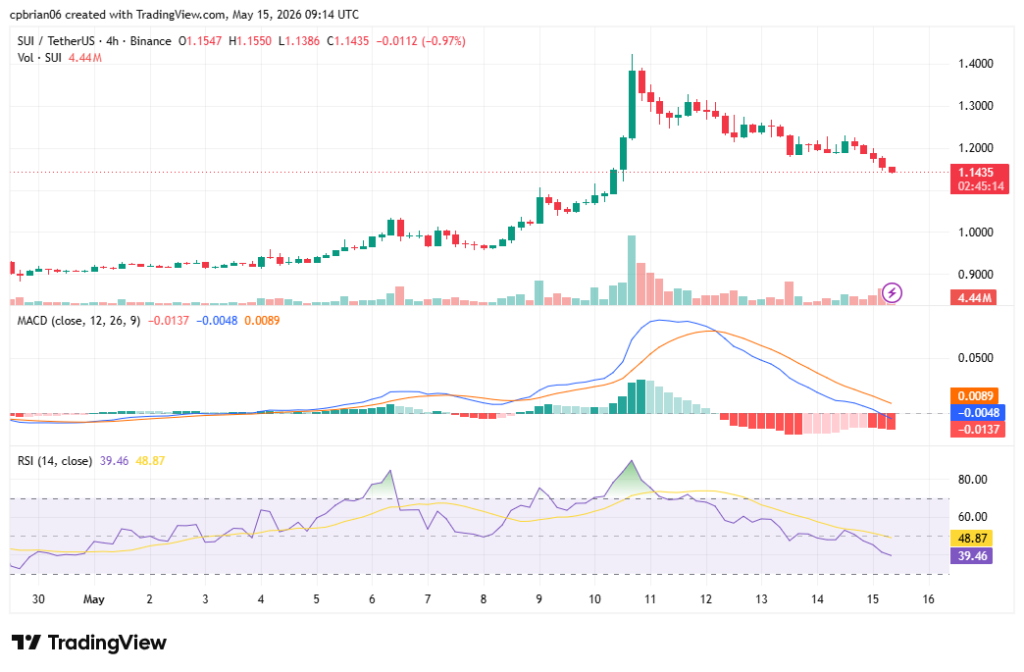
SUI is more volatile on this timeframe, highlighting its bear run. The latest candle formation, three black crows, is suggestive of a bearish continuation.
SUI technical indicators: Levels and action
Daily simple moving average (SMA)
| Period | Value ($) | Action |
| SMA 3 | 1.25 | SELL |
| SMA 5 | 1.23 | SELL |
| SMA 10 | 1.10 | BUY |
| SMA 21 | 1.01 | BUY |
| SMA 50 | 0.9571 | BUY |
| SMA 100 | 0.9564 | BUY |
| SMA 200 | 1.32 | SELL |
Daily exponential moving average (EMA)
| Period | Value ($) | Action |
| EMA 3 | 1.22 | SELL |
| EMA 5 | 1.20 | SELL |
| EMA 10 | 1.13 | BUY |
| EMA 21 | 1.06 | BUY |
| EMA 50 | 1.00 | BUY |
| EMA 100 | 1.08 | BUY |
| EMA 200 | 1.41 | SELL |
What to expect from the SUI price analysis next?
According to technical indicators, SUI is bearish. The charts indicate negative momentum on the shorter timeframes, with the target at the $1.09 support level.
Why is SUI down?
Sui’s price pulled back after strong selling pressure near the $1.40 resistance. The retreat toward the $1.09 support zone represents a cooling-off period following a 17.81% rally over the past week.
Recent news
The Sui platform is seeing a sharp rise in user activity, with both daily active users and new accounts spiking in recent weeks. At one point, new users surged to nearly 800K, highlighting a sudden wave of attention on the network. But the price isn’t reflecting that strength—at least not yet.
Will SUI reach $10?
According to the Cryptopolitan price prediction, SUI is expected to reach $10 in 2027, with an average price of $10.83 for the year.
Will SUI reach $100?
It remains unlikely that SUI will rise to $100 before 2032.
Will SUI reach $1,000?
It remains unlikely that SUI will rise to $1,000 before 2032.
How high can Sui go?
Per the Cryptopolitan price prediction, SUI could reach $4.77 by the end of 2026.
Is SUI crypto a good investment?
Should the market sentiment change, SUI will rise to its previous highs. SUI’s price predictions for 2032 are optimistic as the global adoption of decentralized applications rises.
SUI price prediction May 2026
The SUI price forecast for May ranges from a minimum of $0.78 to a maximum of $1.90. The average price for the month will be $1.30.
| Month | Potential low ($) | Potential average ($) | Potential high ($) |
| May | 0.78 | 1.06 | 1.40 |
SUI price prediction 2026
For 2026, SUI’s price will range between $0.68 and $2.07. The average price for the year will be $1.77.
| Year | Potential low ($) | Potential average ($) | Potential high ($) |
| 2026 | 0.68 | 1.77 | 2.07 |
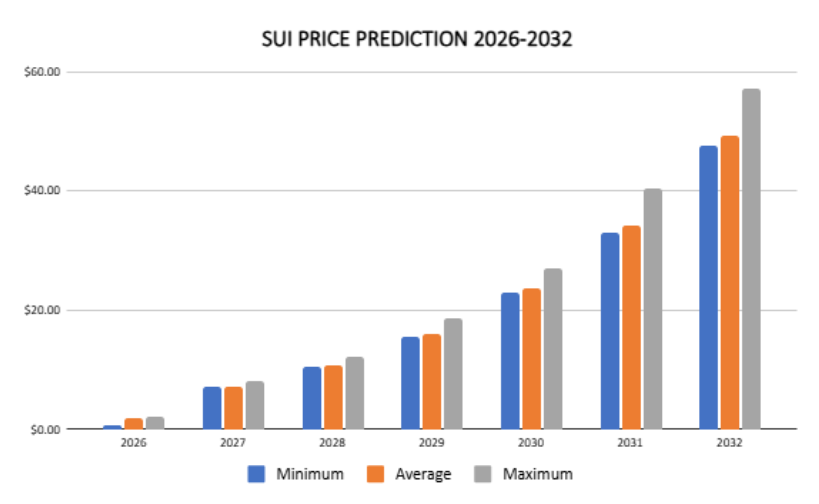
SUI price prediction 2027-2032
| Year | Potential low ($) | Potential average ($) | Potential high ($) |
| 2027 | 7.05 | 7.24 | 8.16 |
| 2028 | 10.47 | 10.83 | 12.10 |
| 2029 | 15.50 | 16.04 | 18.66 |
| 2030 | 22.96 | 23.77 | 27.04 |
| 2031 | 33.01 | 34.20 | 40.39 |
| 2032 | 47.50 | 49.21 | 57.09 |
Sui price prediction 2027
SUI coin price prediction estimates it will range between $10.47 and $12.10, with an average of $10.83.
Sui price prediction 2028
SUI network coin price prediction climbs even higher into 2028. According to the prediction, the SUI cost will range between $15.50 and $18.66, with an average price of $16.04.
Sui price prediction 2029
According to the SUI forecast for 2029, the price of SUI will range from $22.96 to $27.04, with an average closing price of $23.77.
Sui price prediction 2030
According to the 2030 SUI price prediction, the price will range from $33.01 to $40.39, with an average of $34.20.
Sui price prediction 2031
The SUI crypto price forecast for 2031 is a maximum price of $57.09. It will reach a minimum price of $47.50 and an average price of $49.21.
Sui crypto price prediction 2032
The SUI’s price prediction ranges from $7.05 to $8.16, with an average of $7.24. The predictions indicate long-term growth.
SUI market price prediction: Analysts’ SUI price forecast
| Platform | 2026 | 2027 | 2028 |
| Gate.com | $0.9421 | $1.12 | $1.18 |
| Coincodex | $0.7226 | $1.63 | $1.08 |
Cryptopolitan’s SUI price prediction
Our predictions show that SUI will achieve a high of $2.07 in 2026. In 2028, it will range between $10.47 and $12.10, with an average of $10.83. In 2030, it will range between $33.01 and $40.39, with an average of $34.20. Note that the predictions are not investment advice. Seek independent consultation or do your own research.
SUI historic price sentiment
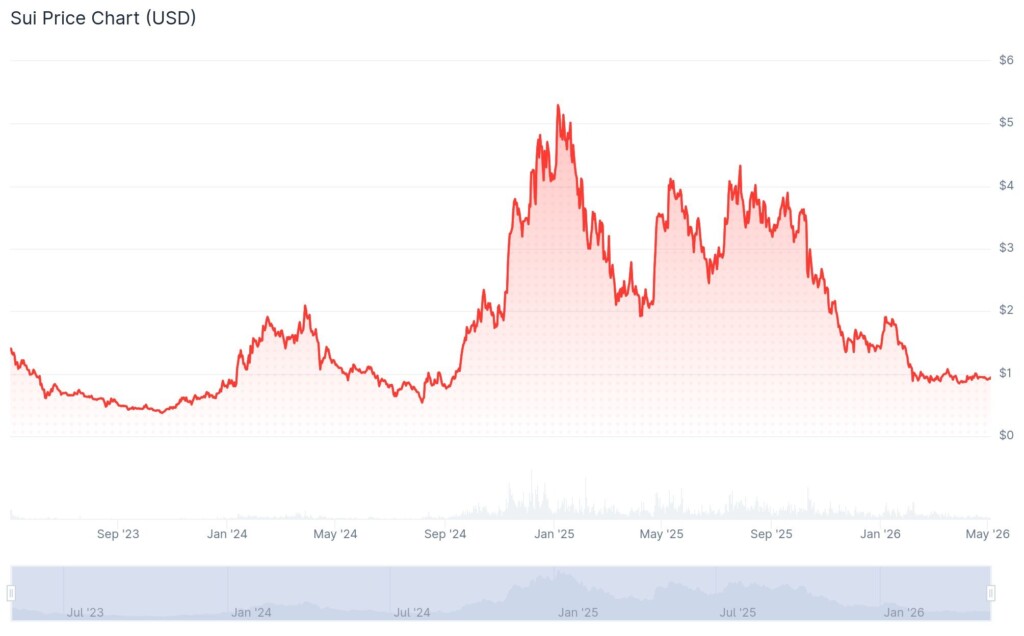
- Exchanges such as Binance, OKX, KuCoin, and Bybit hosted activities toward the initial distribution of SUI in April 2023.
- SUI initially traded at $2.10, well above the $0.10 investors paid during its public sale at the end of April.
- A bear run preceded the listing, and on October 23, 2023, it fell to its lowest price, $0.3643.
- It started recovering in November 2023.
- It reached its highest price on March 27, 2024, at $2.18, after the Greek stock exchange announced a possible collaboration.
- On May 21, 2024, the SUI network surpassed 1 million daily active wallets. In August, it traded at $0.57.
- It later rose and broke above $1.5 in September and $2 in October.
- The bull market run continued into November, reaching a new all-time high on January 6, 2025, at $5.35. Later, it quickly reversed, falling below $3.50 in February and $2.00 in April.
- It began recovering in May, rising above $3.50. In July, it fell below $3.0. It rose to $3.60 by October, then entered a bear run.
- By November, it had dropped to $2, and in December to $1.6.
- In January 2026, it recovered to $1.9, but erased those gains in February, falling below $1. It reached $0.90 in April and $0.94 in May.
This articles is written by : Nermeen Nabil Khear Abdelmalak
All rights reserved to : USAGOLDMIES . www.usagoldmines.com
You can Enjoy surfing our website categories and read more content in many fields you may like .
Why USAGoldMines ?
USAGoldMines is a comprehensive website offering the latest in financial, crypto, and technical news. With specialized sections for each category, it provides readers with up-to-date market insights, investment trends, and technological advancements, making it a valuable resource for investors and enthusiasts in the fast-paced financial world.