TLDR:
- SUI is trading at $1.0651, sitting 17.6% below its 200-day moving average resistance level of $1.2873.
- RSI has recovered from extreme oversold levels to a neutral 51, leaving room for price to move in either direction.
- MACD has not crossed bullish yet, but the narrowing gap between lines signals building momentum below the surface.
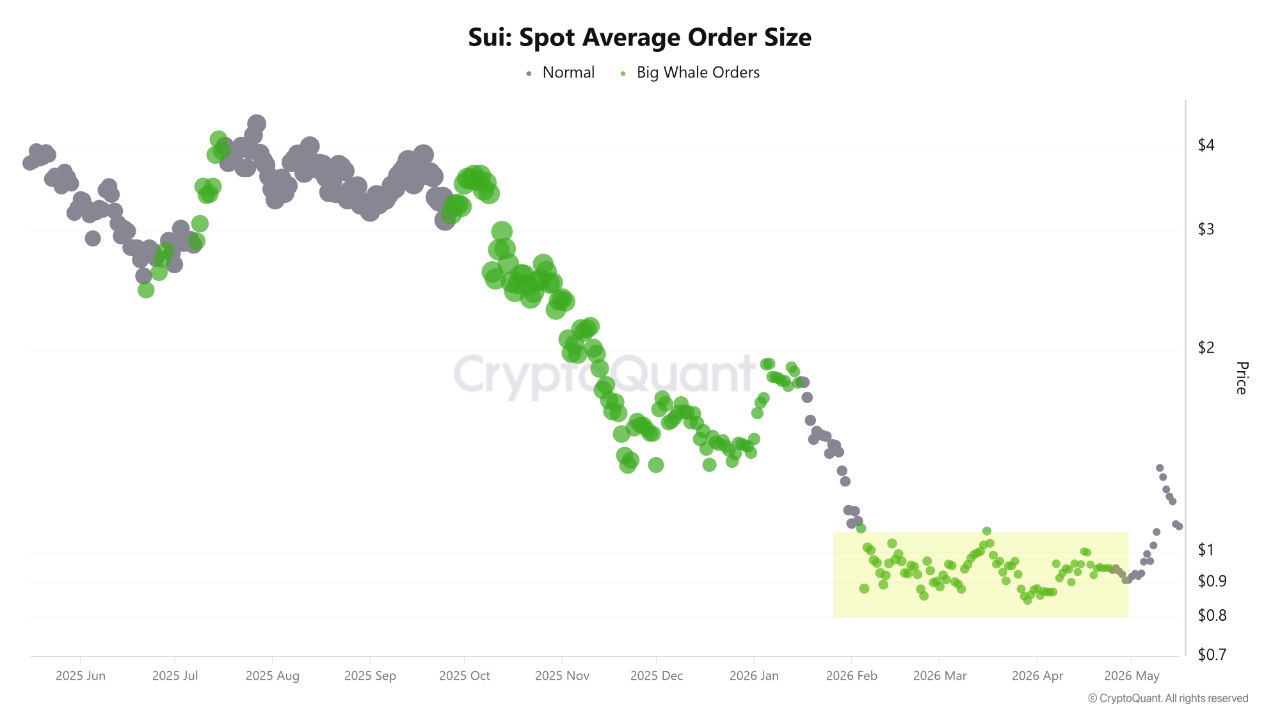
- CryptoQuant data shows large orders clustering at $0.90–$1.00, pointing to whale accumulation ahead of a potential rebound.
SUI is trading at $1.0651, sitting 17.6% below its 200-day moving average of $1.2873. The token dropped from $4.00 to $0.50 over four months before stabilizing.
Technical analysts are now watching closely as momentum indicators show early signs of recovery. Meanwhile, on-chain data from CryptoQuant points to large-order accumulation near key support zones. The chart structure tells a more layered story than the price decline alone suggests.
Technical Indicators Point to a Market in Transition
SUI printed a capitulation bottom near $0.50 in late 2025. Volume spiked sharply at those lows, which typically marks seller exhaustion rather than continued distribution. That kind of price action usually separates a dying asset from one completing a base.
Since that bottom, the Relative Strength Index has climbed from extreme oversold territory back to 51. That reading is neutral — not extended to the upside, and not under further selling pressure. It gives the chart room to move in either direction.
Analyst account @2xnmore noted that the MACD has not crossed bullish yet, but the gap between the MACD line and the signal line is narrowing.
The momentum engine is building without having triggered a confirmed buy signal. That is an important distinction.
The 200-day moving average at $1.2873 remains the key structural line. A high-volume daily close above that level would shift the chart from bearish to neutral.
A MACD crossover on top of that would then move the structure from neutral to bullish. Neither has happened yet.
Whale Order Data Suggests Accumulation at the $0.90–$1.00 Zone
On-chain researcher Rei Researcher referenced CryptoQuant’s Spot Average Order Size data to track large-player behavior.
The data shows large-volume orders clustering around the $0.80–$1.00 range during market lulls, without pushing price lower. That pattern has preceded rebounds before.

Source: Cryptoquant
The $0.90–$1.00 zone appears to function as a solid support band. When large orders repeatedly fill at that level without breaking it, it suggests institutional positioning rather than exit. That behavior contrasts with panic-driven retail selling at cycle lows.
If SUI corrects back toward that range and large-order activity increases, analysts consider it a bullish signal for the next move higher. The re-fill pattern at that level is what traders are now watching for on future dips.
The broader picture is that SUI remains in a technical rebuild phase. Price is below the 200-day MA, but the base structure and whale footprint both suggest the selling pressure has already been absorbed at lower levels.
The post SUI Price Holds at $1.06 as Chart Base and Whale Accumulation Signal a Potential Reversal appeared first on Blockonomi.
This articles is written by : Nermeen Nabil Khear Abdelmalak
All rights reserved to : USAGOLDMIES . www.usagoldmines.com
You can Enjoy surfing our website categories and read more content in many fields you may like .
Why USAGoldMines ?
USAGoldMines is a comprehensive website offering the latest in financial, crypto, and technical news. With specialized sections for each category, it provides readers with up-to-date market insights, investment trends, and technological advancements, making it a valuable resource for investors and enthusiasts in the fast-paced financial world.