Key Takeaways
- DOGE trades within a tightening pennant formation featuring converging trendlines as lower highs and higher lows squeeze toward an apex point.
- Market capitalization analysis reveals a parallel triangle pattern approaching a descending resistance boundary, with a potential upside target reaching $73.19 billion.
- Current price action shows DOGE testing the 0.618 Fibonacci fan zone, resembling the 0.5 Fib fan bounce that sparked the October 2024 surge toward $0.48.
- Critical support zone established at $0.095; breaking below this threshold on a weekly timeframe could invalidate the bullish consolidation structure.
- Technical analyst Trader Tardigrade identifies parallels between current accumulation behavior and historical compression cycles from 2015, 2019, and 2025 that preceded major rallies.
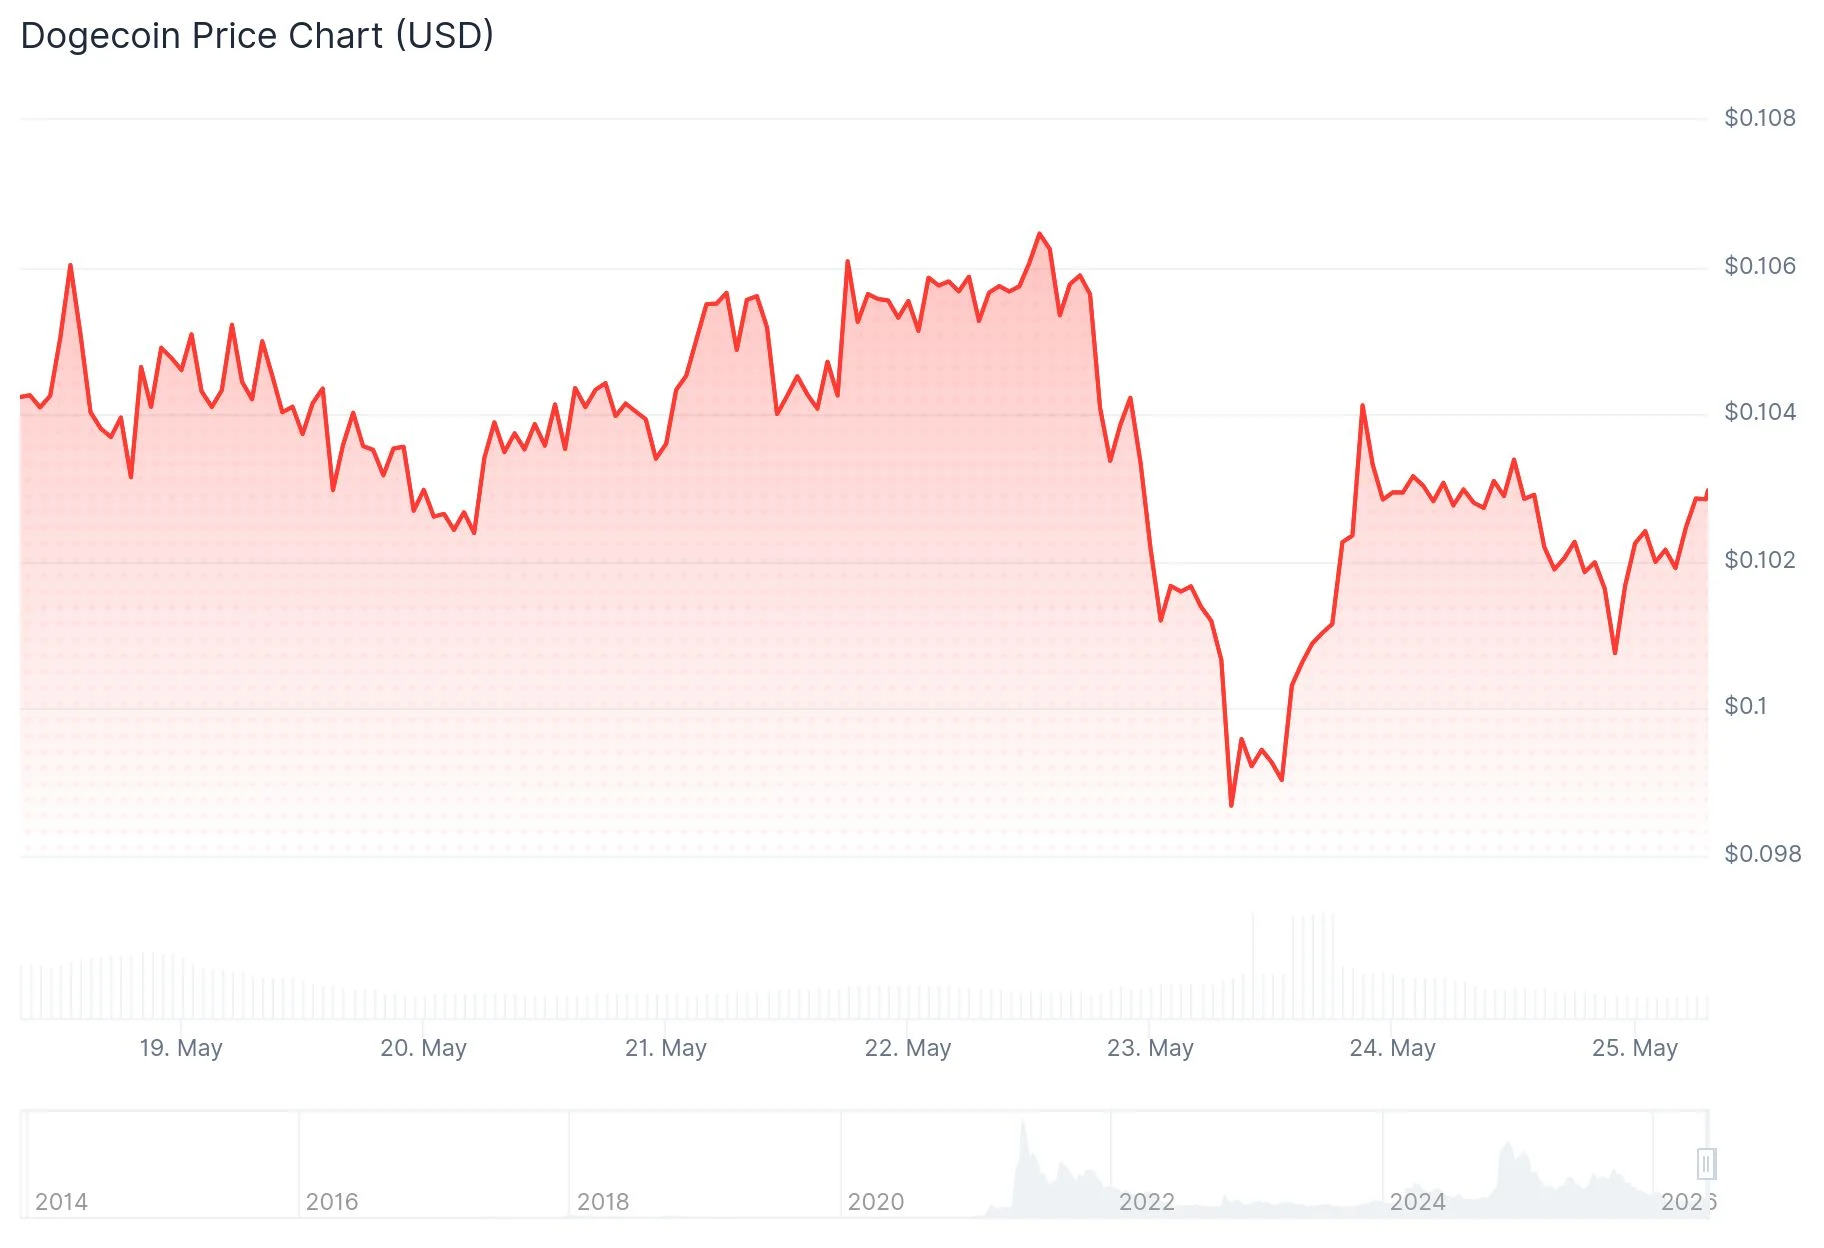
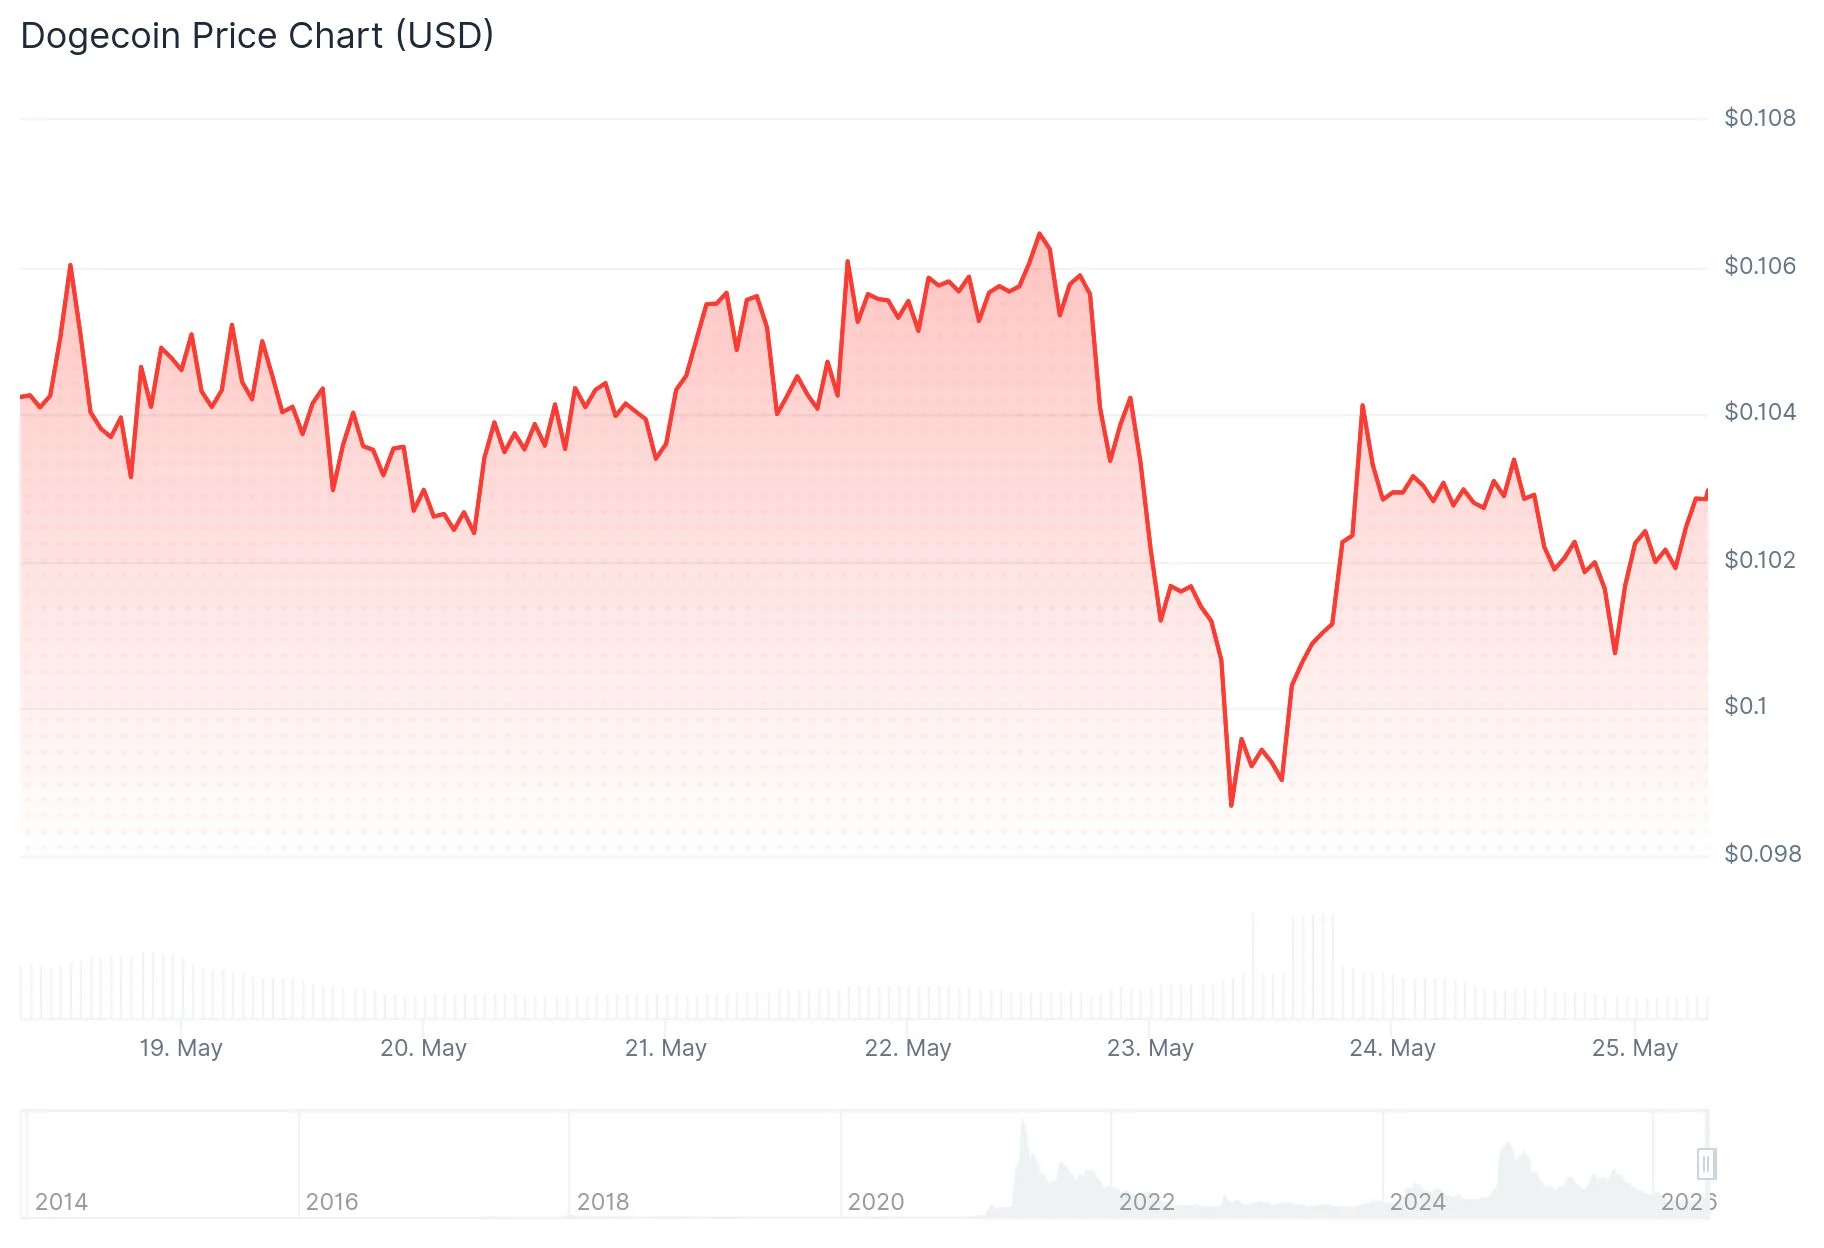
Dogecoin (DOGE) finds itself positioned at a pivotal technical juncture. Trading near $0.1028, the cryptocurrency remains confined within two converging compression structures that market observers believe will dictate its upcoming directional move.
The primary formation visible on price charts is an extended pennant structure. Technical analyst Bitcoinsensus highlighted this configuration on X, illustrating how DOGE has established a sequence of descending peaks alongside ascending troughs following its previous rally high. This convergence produces a contracting triangle where price action compresses toward a critical decision point.
$DOGE FORMING A LARGE PENNANT STRUCTURE
DOGE is compressing inside a long-term pennant after its major impulse move#DOGE #Crypto #Memecoin pic.twitter.com/wWUd05eVPV
— Bitcoinsensus (@Bitcoinsensus) May 24, 2026

The pennant’s upper boundary has repeatedly rejected upward price attempts. Each bullish advance toward this resistance has encountered selling pressure that prevented breakthrough. Conversely, the lower boundary has functioned as an ascending floor since the 2022 bottom, with DOGE successfully defending this support on multiple tests.
No definitive breakout has materialized. Unless DOGE produces a convincing close beyond the upper resistance boundary, sideways movement within the contracting range appears likely to persist.
Parallel Triangle Formation Emerges on Market Capitalization Chart
The compression narrative gains reinforcement when examining Dogecoin’s total market capitalization. Analyst DonWedge presented data illustrating the market cap trapped within its own extended triangle structure, approaching an apex created by descending resistance originating from the 2021 peak intersecting with ascending support.
A decisive breach above the highlighted yellow resistance area on the market cap visualization could unlock movement toward a $73.19 billion objective, per the technical projection. Present market capitalization remains substantially beneath that threshold. The primary downside risk centers on the lower purple support trendline. Should market cap penetrate below this foundation, the entire compression thesis would face significant deterioration.
DOGE has yet to trigger breakout confirmation on either analytical framework.
Fibonacci Fan Configuration Echoes 2024 Pre-Breakout Structure
An alternative technical perspective employing a Fibonacci fan projection anchored to the 2021 peak of $0.7316 suggests a potential recurrence of October 2024 price behavior. During that period, DOGE retested and validated the 0.5 Fibonacci fan level before launching an advance that reached $0.48 by December 2024.
Present conditions show DOGE interacting with the 0.618 Fibonacci fan within the $0.10–$0.11 zone. Market technician @_CryptoSurf identified this configuration on TradingView.
For this scenario to materialize, bulls must defend $0.095 on weekly closing basis and establish momentum above $0.115, subsequently reclaiming $0.14. A weekly settlement beneath $0.095 would instead suggest continued range-bound activity between $0.095 and $0.08.
Market analyst Trader Tardigrade (TATrader_Alan) provided perspective on the DOGE monthly timeframe, suggesting that the 2025-2026 period exhibits characteristics consistent with previous accumulation phases observed during 2015-2017 and 2019-2020—both intervals that preceded substantial price advances. He characterized the current environment as “the best accumulation period” while emphasizing that historical DOGE accumulation zones consistently resolved with exponential upward movements.
$Doge/monthly
This is the window
#Dogecoin is still in the best accumulation period — and history proves exactly what happens next.
Every single time $DOGE entered an accumulation zone, it consolidated sideways before exploding into a parabolic rally.
2015-2017:… pic.twitter.com/AYzZI8nBoQ
— Trader Tardigrade
(@TATrader_Alan) May 23, 2026
As of this writing, Dogecoin maintains a price level of $0.1028.
The post Dogecoin (DOGE) Trapped in Multi-Year Triangle Pattern as Breakout Looms appeared first on Blockonomi.
This articles is written by : Nermeen Nabil Khear Abdelmalak
All rights reserved to : USAGOLDMIES . www.usagoldmines.com
You can Enjoy surfing our website categories and read more content in many fields you may like .
Why USAGoldMines ?
USAGoldMines is a comprehensive website offering the latest in financial, crypto, and technical news. With specialized sections for each category, it provides readers with up-to-date market insights, investment trends, and technological advancements, making it a valuable resource for investors and enthusiasts in the fast-paced financial world.