
Key Takeaways
- A falling wedge pattern has emerged on Dogecoin’s 1-hour chart, with critical resistance identified between $0.110 and $0.120
- Despite 24-hour trading volume declining 3.10%, open interest increased 1.92% to reach $1.27 billion
- Technical analysts suggest a breakout beyond the wedge formation could propel DOGE toward $0.150, though falling below $0.080 presents downside risk
- Last month, DOGE reached its weakest price point since 2023, bottoming near $0.068
- The total circulating supply currently sits at 155.9 billion tokens, expanding by 5 billion annually
Dogecoin (DOGE) has positioned itself at a crucial technical juncture as market participants monitor a developing falling wedge formation. The popular memecoin hovers around $0.0835, retreating from its mid-August peak that touched approximately $0.10.
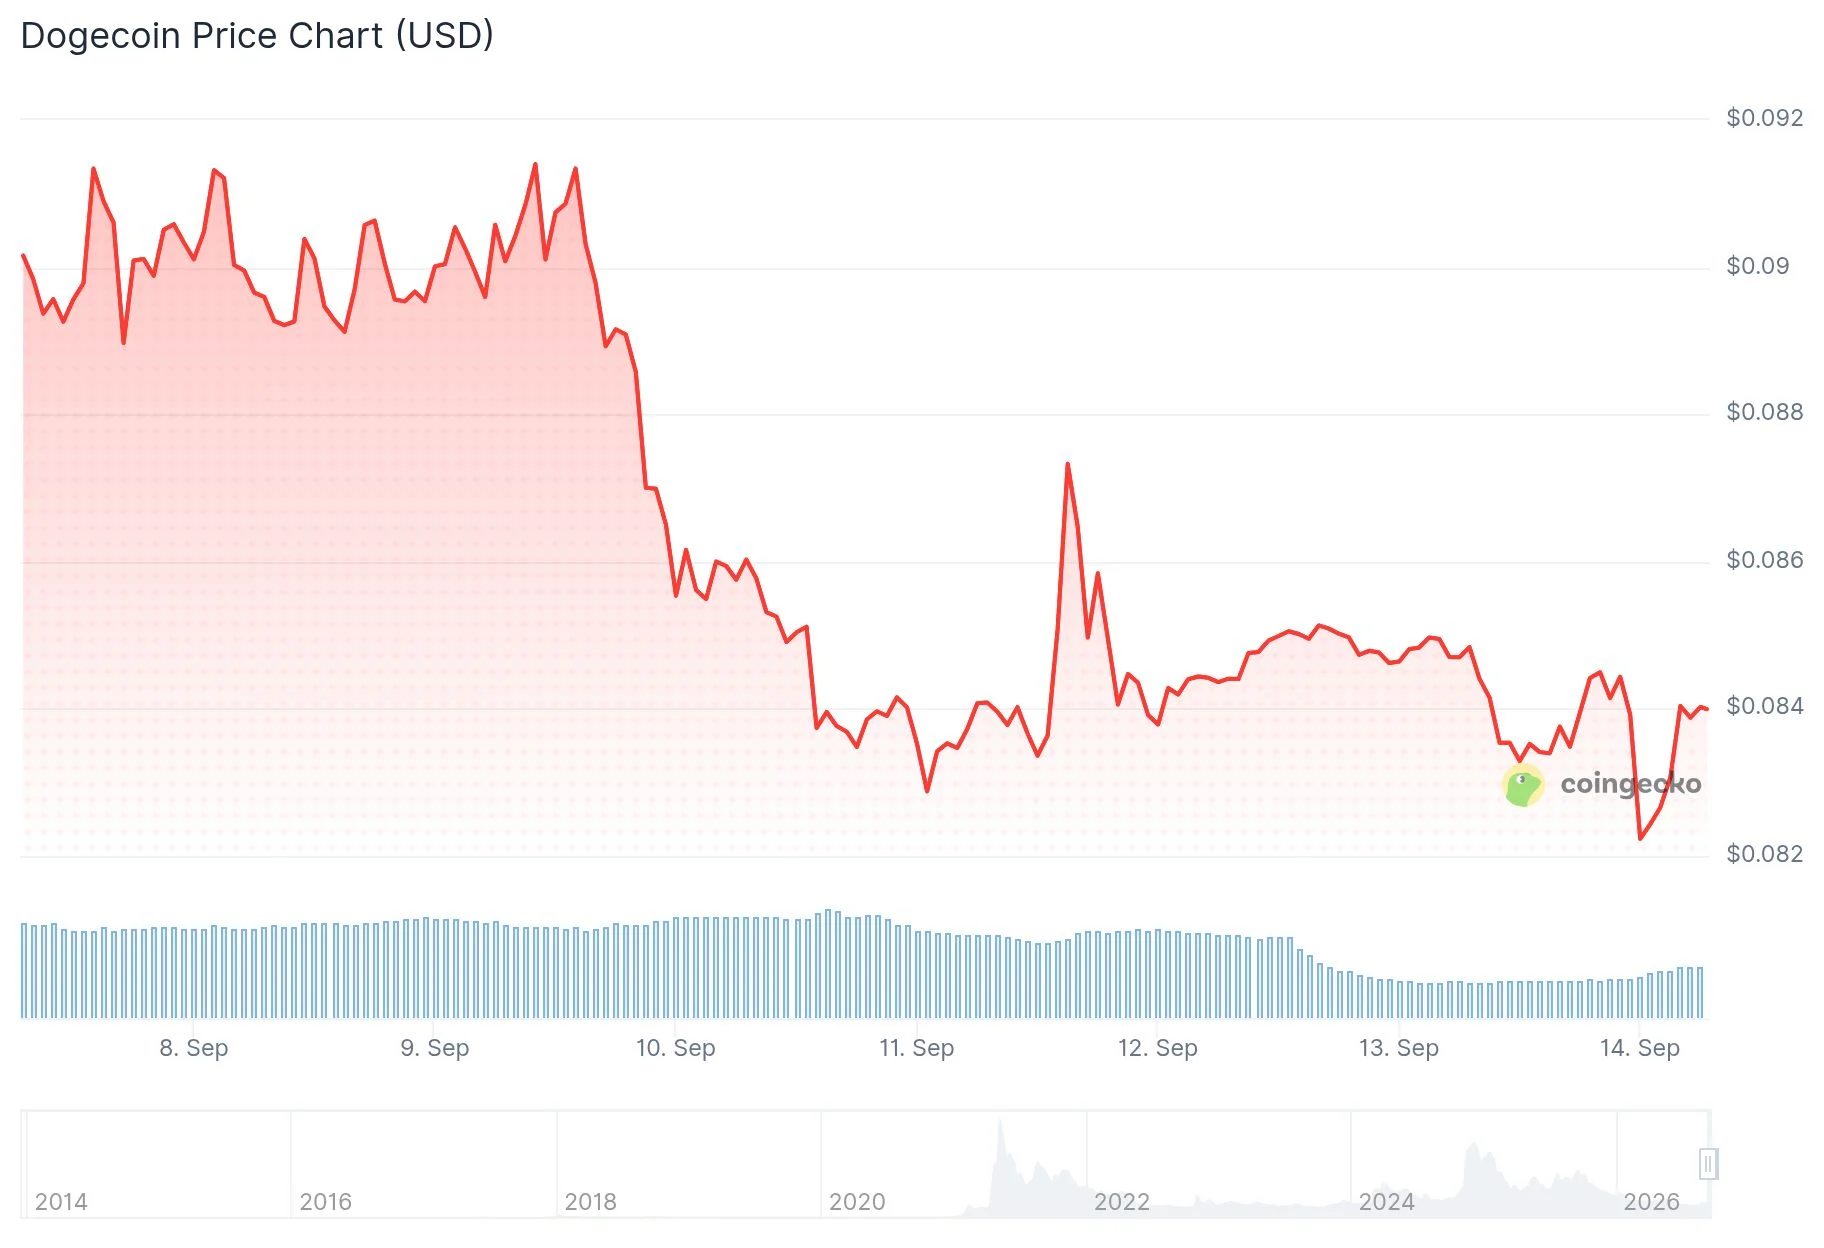
Technical analyst Crypto With Gopal highlighted the emerging falling wedge structure visible on the hourly timeframe. His analysis pinpoints $0.100 as a significant threshold, while identifying the $0.110–$0.120 band as the primary resistance area that buyers must overcome.
Meanwhile, analyst Trader Tardigrade examined broader market cycles on the monthly timeframe. His assessment reveals DOGE forming a rounded bottom combined with a descending trendline configuration that resembles formations observed before two earlier explosive rallies, suggesting what he characterizes as a potential “cycle ignition” scenario upon trendline breach.
$DOGE/monthly — Fractal Repeat
#Dogecoin is printing the exact same pattern that triggered the two previous parabolic cycles.
Rounded bottom forming
Descending trendline resistance
Breakout above trendline = cycle ignition
The structure is identical. Both… pic.twitter.com/zbFEVoHWKH
— Trader Tardigrade
(@TATrader_Alan) September 13, 2026

Should DOGE successfully breach the wedge pattern’s upper boundary, Crypto With Gopal’s technical analysis projects a move toward $0.150. This represents significant appreciation from present levels, though the analyst emphasizes this projection serves as a technical objective rather than a guaranteed outcome.
Technical Indicators Signal Weakness
The memecoin has slipped beneath its 20-day Simple Moving Average, currently positioned at $0.08589. The MACD indicator has generated a bearish crossover, with the MACD line dipping under its signal line, while expanding negative histogram bars indicate mounting selling pressure.
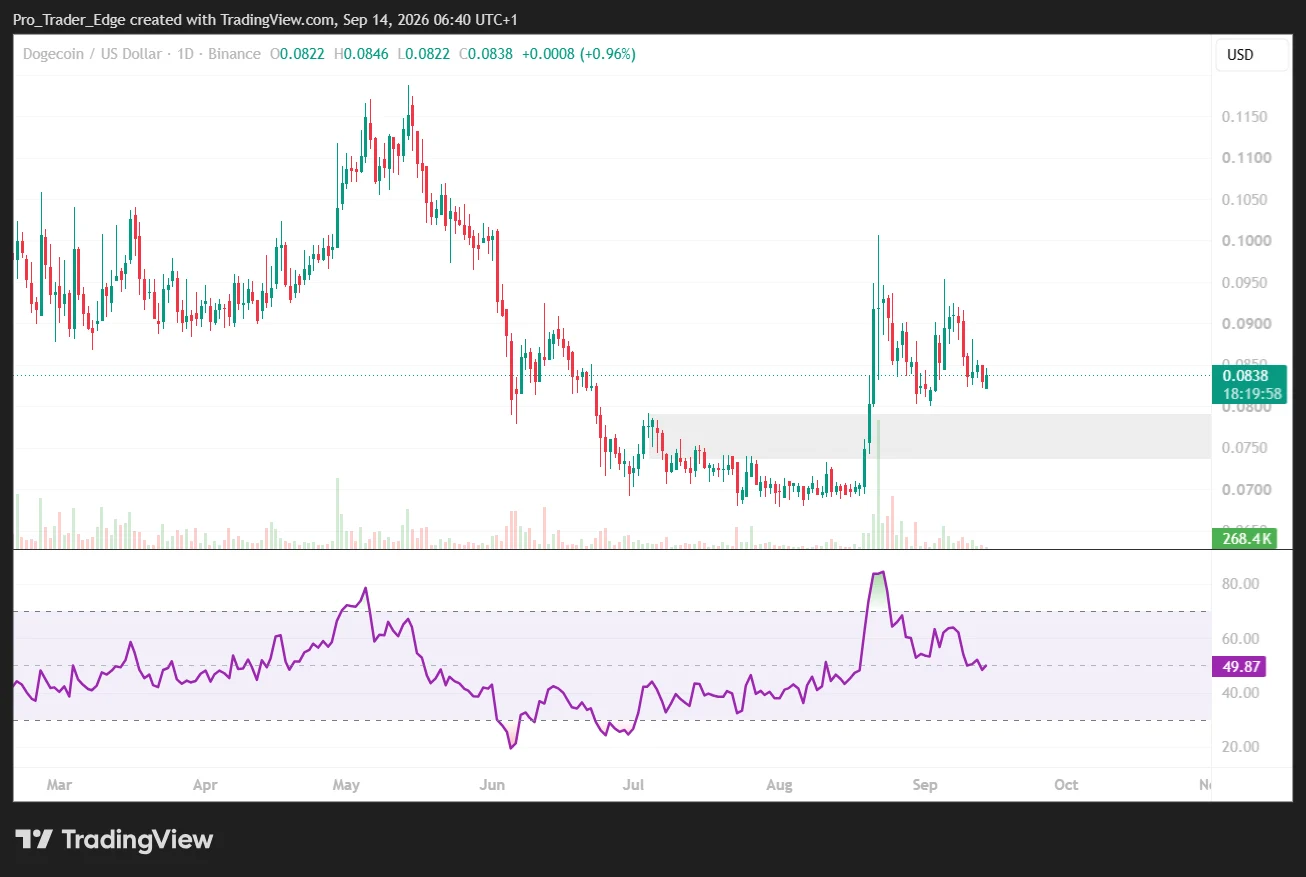
The lower boundary of the Bollinger Bands resides around $0.08003. A decisive breach below the $0.080 support threshold would likely negate the constructive technical outlook and potentially trigger additional selling.
Futures Market Activity Remains Elevated
According to Coinglass metrics, daily trading volume contracted 3.10% to settle at $710.71 million, yet open interest expanded 1.92% to approximately $1.27 billion. Data from Dogegod indicates open interest represents roughly 16.38 billion DOGE tokens, translating to about $1.5 billion in notional value.
Elevated open interest coupled with contracting volume indicates market participants maintain leveraged positions while awaiting a definitive directional move. This positioning dynamic could magnify price action in either direction once a breakout or breakdown materializes.
The cryptocurrency recorded its weakest valuation since 2023 during August, bottoming at $0.068. While DOGE has recovered from that trough, it remains substantially below its 2021 all-time high of $0.73.
The current circulating supply totals 155.9 billion tokens. An inflationary mechanism introduces 5 billion additional coins annually, creating persistent supply-side pressure on valuation. Unlike Bitcoin, Dogecoin has no maximum supply cap.
Cryptocurrency directory Cryptwerk reports that just 2,328 merchants globally currently accept DOGE as a payment method.
The post Dogecoin (DOGE) Forms Falling Wedge Pattern as Analysts Eye Historical Rally Setup appeared first on Blockonomi.
This articles is written by : Nermeen Nabil Khear Abdelmalak
All rights reserved to : USAGOLDMIES . www.usagoldmines.com
You can Enjoy surfing our website categories and read more content in many fields you may like .
Why USAGoldMines ?
USAGoldMines is a comprehensive website offering the latest in financial, crypto, and technical news. With specialized sections for each category, it provides readers with up-to-date market insights, investment trends, and technological advancements, making it a valuable resource for investors and enthusiasts in the fast-paced financial world.