TLDR:
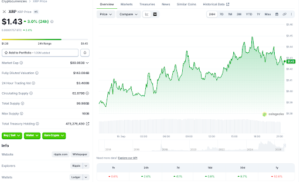
- XRP trades at $1.43, up 3.13% in 24 hours and 4.10% over seven days, on $3.41 billion in volume.
- Ali Charts sees an inverse head-and-shoulders pattern with a $1.55 neckline and a 35% rally target.
- Large holders accumulated about 1.54 billion XRP, worth around $2.2 billion, over the past 96 hours.
XRP price trades at $1.43 at the time of writing, according to Coingecko market data. The token gained 3.13% over the past 24 hours and 4.10% across the past seven days. Trading volume stands at $3,408,218,413 during the same 24-hour period.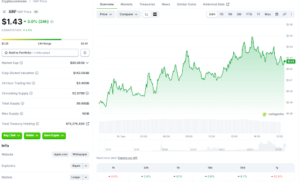
Source: Coingecko
Analysts now track a possible inverse head-and-shoulders pattern, a key Fibonacci zone, and rising whale accumulation. Together, these factors point to a test of resistance between $1.45 and $1.55 in the coming trading sessions.
Inverse Head-and-Shoulders Pattern Targets $2
In a post on X, Ali Charts shared a technical view of XRP on the daily chart. According to the analyst, the asset appears to be forming the right shoulder of an inverse head-and-shoulders pattern. The post carried the headline XRP targets $2.
The neckline sits near $1.55, which the analyst described as the key level. A confirmed breakout above that mark could validate the pattern. In that case, Ali Charts expects a 35% rally toward $2, and possibly higher.
However, the pattern remains incomplete. Ali Charts noted the setup must continue to develop before a move toward the neckline takes shape. The XRP price currently sits $0.12 below that level. Without a breakout, the pattern stays unconfirmed.
Whales Accumulate 1.54 Billion XRP
Separately, Ali Charts pointed to a surge in whale activity on the XRP network. The activity spans the past 96 hours. Large holders appear to have accumulated roughly 1.54 billion XRP.
That amount is worth around $2.2 billion. The analyst described the increase as a notable accumulation spike in recent days. According to Ali Charts, such buying could soon translate into price action and a bullish breakout.
Both posts come from Ali Charts and focus on a possible bullish breakout. The first outlines the chart pattern, while the second cites large-holder buying. The whale data covers 96 hours, while the pattern appears on the daily chart.
XRP Price Faces Key Fibonacci Zone
Analyst ChartNerd offered a separate view based on Fibonacci levels. According to the analyst, XRP is breaking out of its descending resistance structure. The token is also pushing through the 0.382 Fibonacci level.
The next test lies between $1.45 and $1.51, where the 0.5 and 0.618 Fibonacci pockets sit. ChartNerd noted these zones have historically acted as strong decision points.
The XRP price sits just below the lower edge of that range. ChartNerd added that the structure currently favors continuation, though confirmation is key.
Additionally, the weekly chart shows nearly five weeks of tight compression between the 20 and 50 moving averages. The 50-week EMA at $1.51 also comes into play as a critical dynamic level.
ChartNerd said the setup is coiling for a potentially sharp expansion. Decisive weekly closes above $1.51 would support further upside momentum. Conversely, rejection at the Fibonacci levels could send the XRP price back into its range.
The post XRP Price Eyes $2 Target as Whales Accumulate 1.54 billion XRP appeared first on Blockonomi.
This articles is written by : Nermeen Nabil Khear Abdelmalak
All rights reserved to : USAGOLDMIES . www.usagoldmines.com
You can Enjoy surfing our website categories and read more content in many fields you may like .
Why USAGoldMines ?
USAGoldMines is a comprehensive website offering the latest in financial, crypto, and technical news. With specialized sections for each category, it provides readers with up-to-date market insights, investment trends, and technological advancements, making it a valuable resource for investors and enthusiasts in the fast-paced financial world.