AI companies now report revenue figures that were hard to imagine two years ago. Anthropic’s annualized revenue passed $65 billion by the end of July 2026, according to Bloomberg figures reported by Axios. OpenAI passed $40 billion on August 13.
Google, Microsoft and Amazon are also growing fast, mostly through their cloud businesses. At the same time, four large tech firms plan to spend $720 billion to $745 billion on capital projects this year. That raises a simple question about how much money AI brings in compared with what it costs.
This article collects the latest revenue data and explains where each number comes from. Many of the figures are run rates, which take recent sales and project them across a full year. A run rate is not the same as completed annual revenue.
| Company | Latest revenue figure | Source and date |
|---|---|---|
| Anthropic | $65B+ annualized run rate | Bloomberg via Axios, end of July 2026 |
| OpenAI | $40B+ annualized run rate | Reported August 13, 2026 |
| Google Cloud | $24.8B in the second quarter | Q2 2026 results |
| Amazon Web Services | $42.2B in the second quarter, up 37% | Amazon Q2 2026 release |
| Microsoft Cloud | $59.3B in the quarter ended June | Microsoft quarterly results |
| Nvidia data center | $89.0B in Q2 fiscal 2027, up 117% | Nvidia results, August 26, 2026 |
How Big Is the AI Market in 2026?
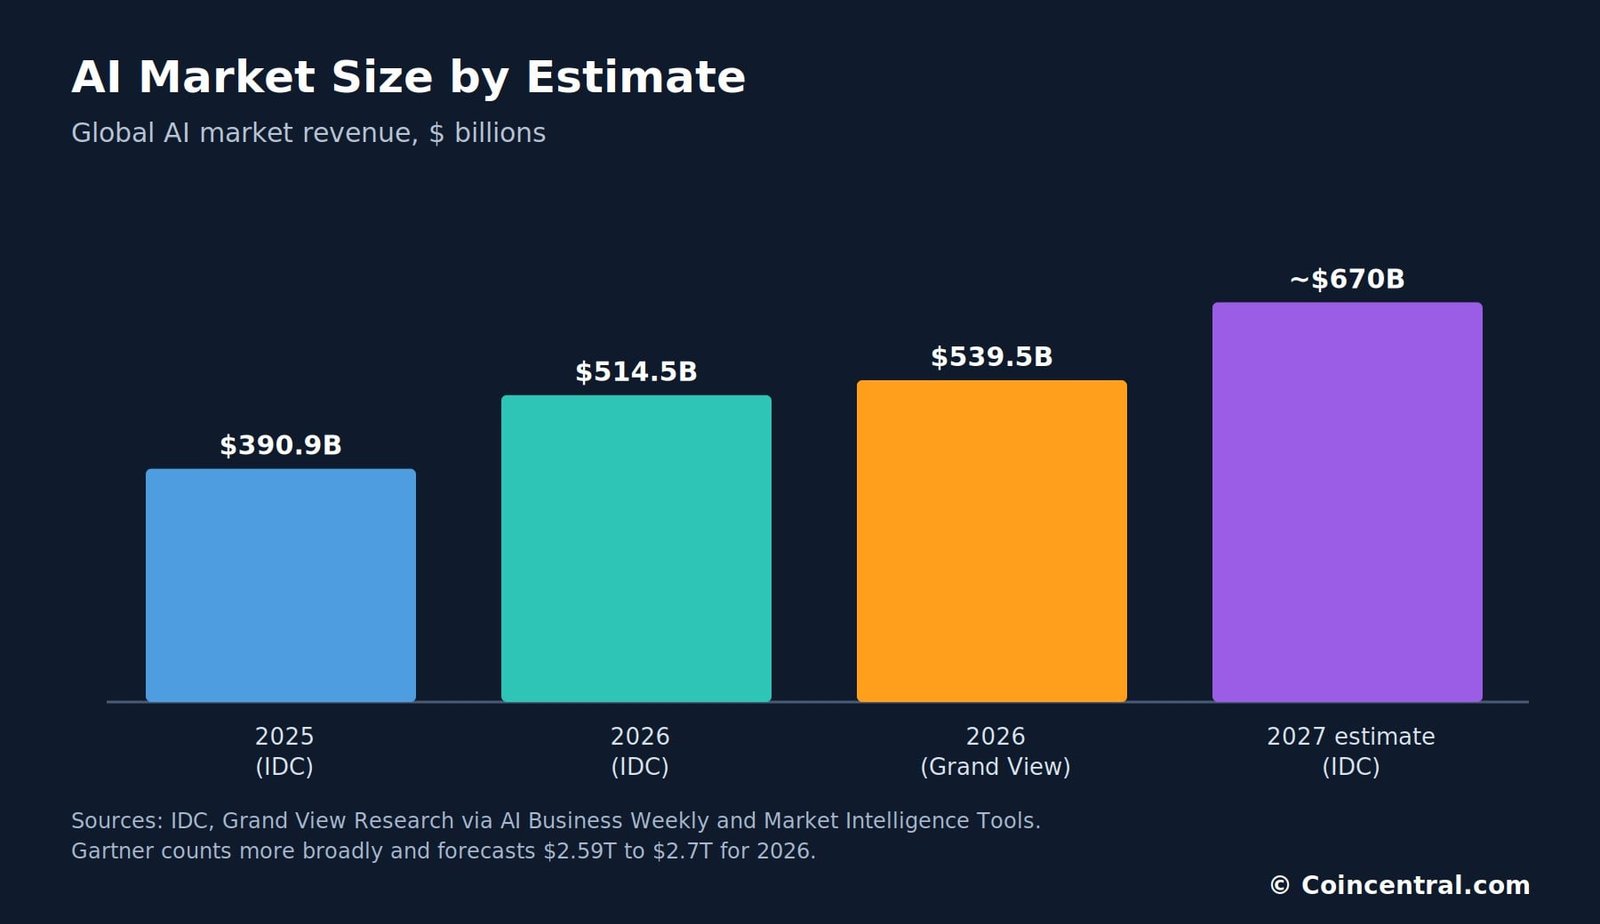
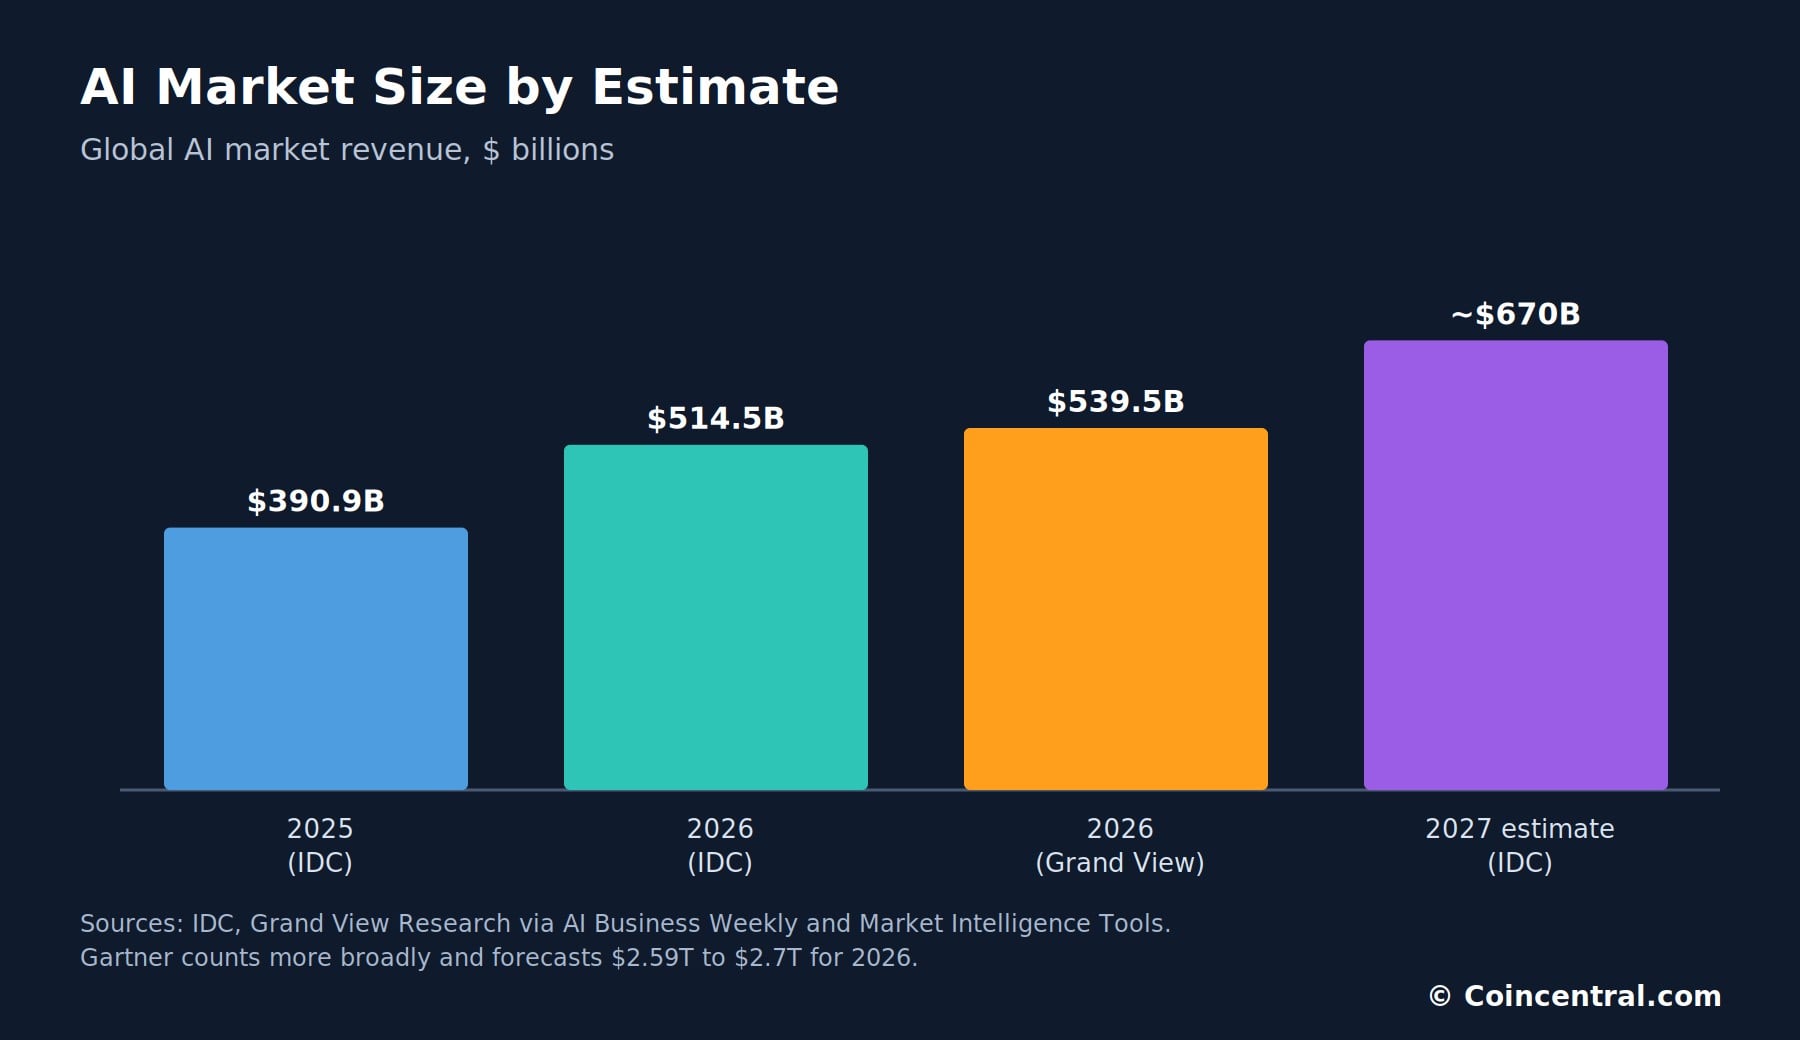
IDC puts the global AI market at $514.5 billion in 2026. That is up 19% from $390.9 billion in 2025. Grand View Research gives a higher 2026 estimate of $539.5 billion.
Grand View expects the market to reach $3,497.3 billion by 2033, a 30.6% yearly growth rate. IDC’s own estimate for 2027 is about $670 billion. Long range forecasts change often, so treat them as estimates.
Some firms count much more. Gartner’s May forecast put worldwide AI spending at $2.59 trillion in 2026, up 47%. A later Gartner figure cited by Market Intelligence Tools is $2.7 trillion, up 49.5%, with about $1.5 trillion going to infrastructure.
The gap comes from what each firm counts. IDC’s main figure covers AI-specific software, hardware and services. Gartner includes all technology spending that AI influences.
| Source | What it counts | 2026 figure |
|---|---|---|
| IDC AI Spending Guide | AI-specific software, hardware and services | $514.5B |
| Grand View Research | AI market revenue | $539.5B |
| IDC AI Infrastructure Tracker | Servers, chips and networking only | $497B |
| Gartner | All AI-influenced technology spending | $2.59T (May), $2.7T (later) |
Generative AI is the fastest-growing part. One compilation puts it at $91.57 billion in 2026, up 45% from $63 billion. IDC data cited by AI Business Weekly puts generative AI at about $127 billion of spending, up 59%.
Gartner forecasts that enterprise spending on AI models and APIs will reach $32.6 billion in 2026, up 110%. These figures differ because the firms use different definitions. No single number fits every purpose.
OpenAI vs Anthropic: Who Earns More?
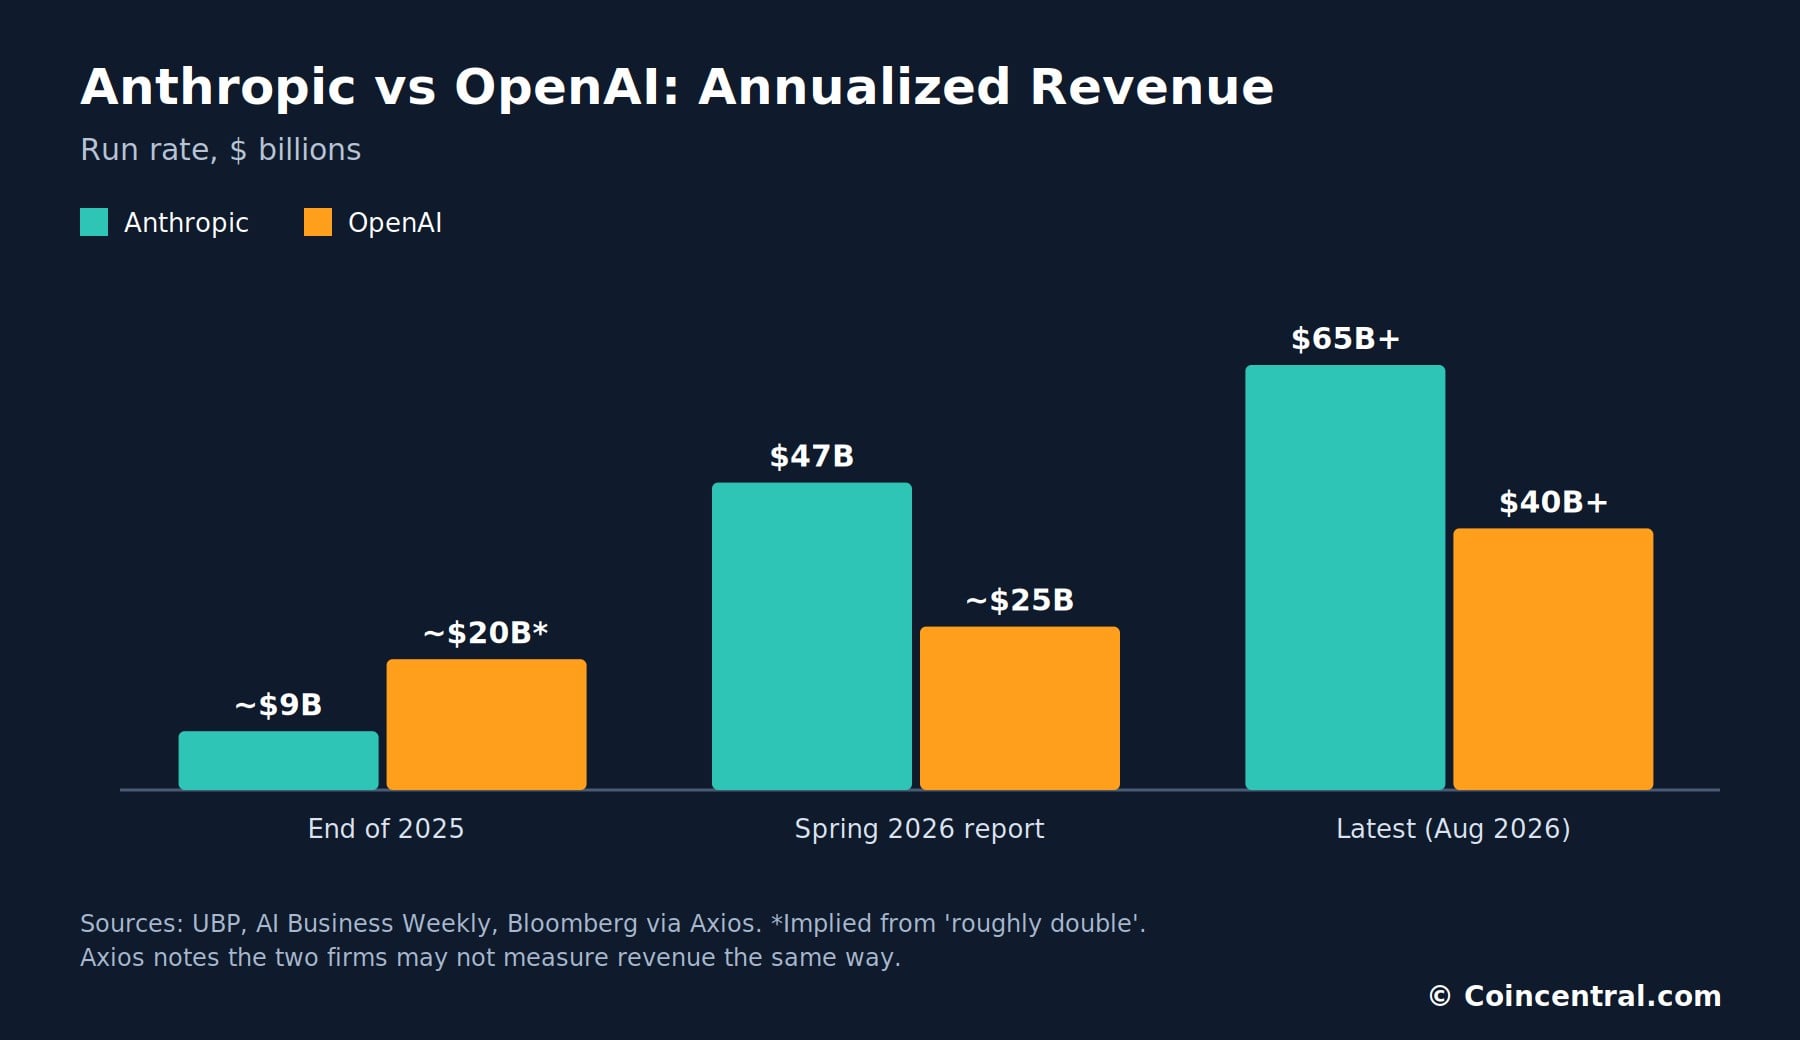
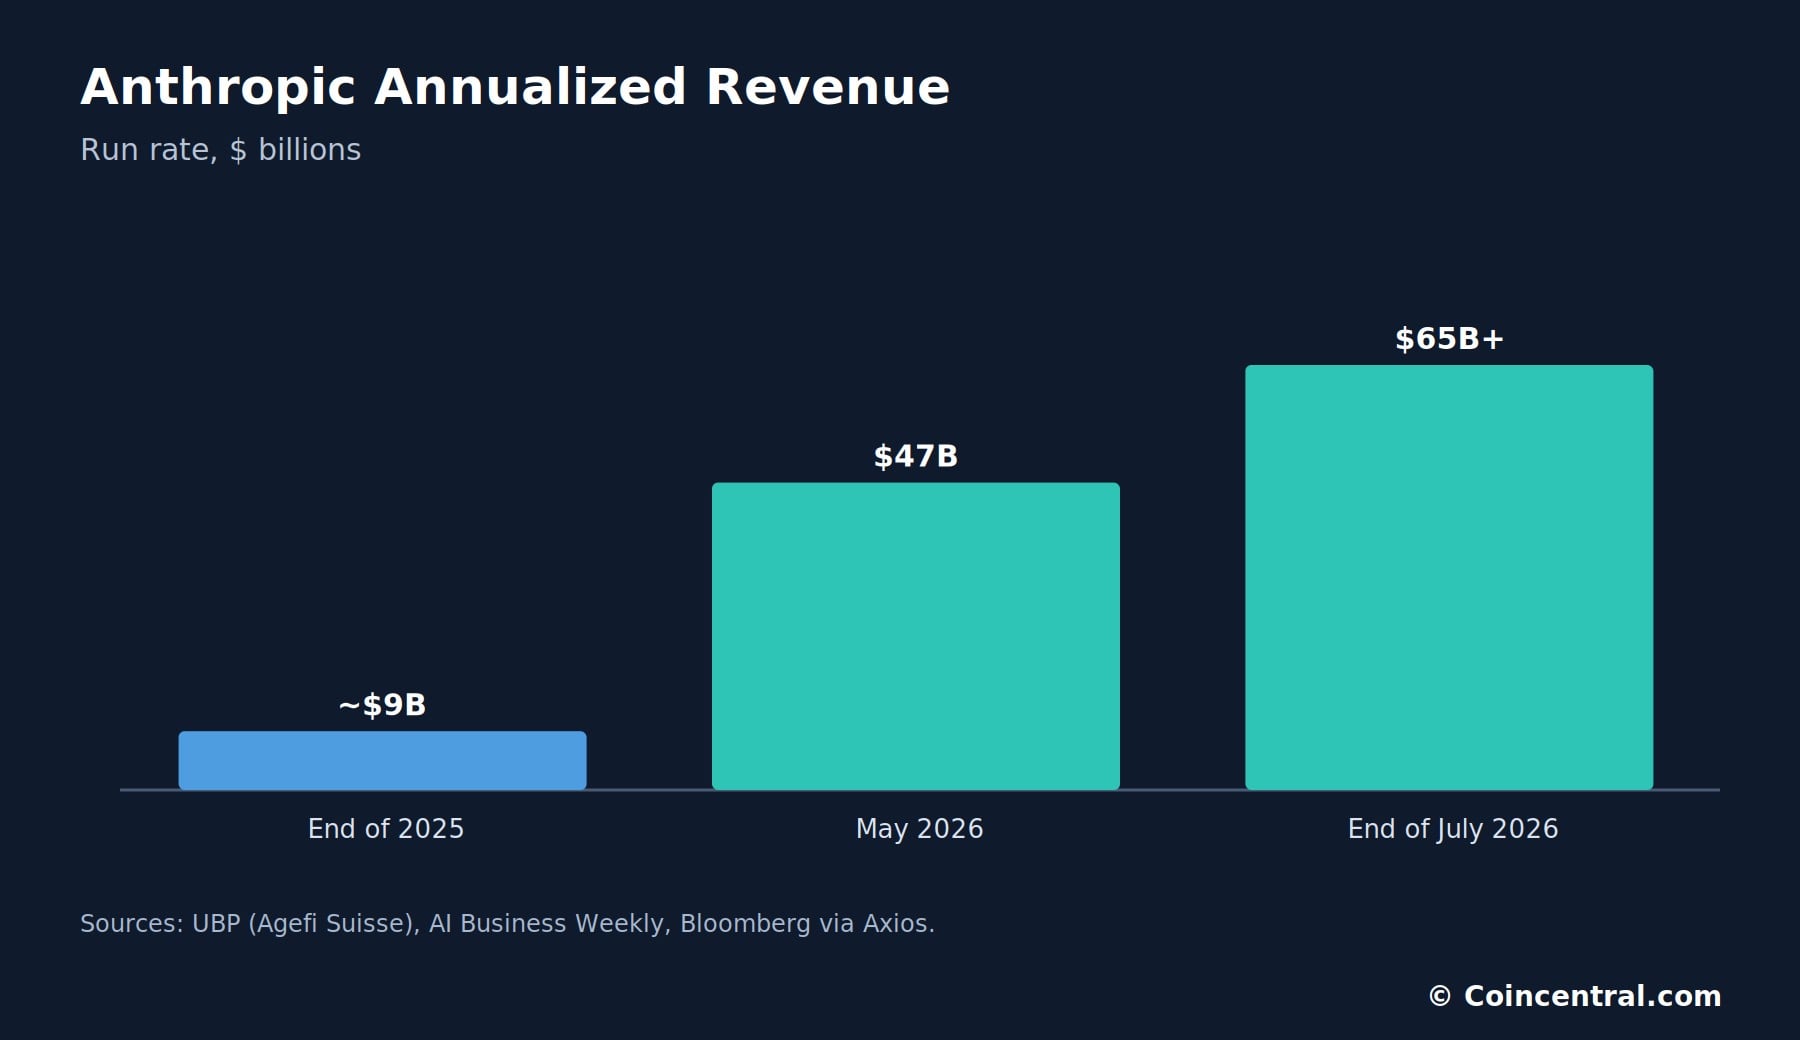
Anthropic now reports the higher run rate. Its annualized revenue was about $9 billion at the end of 2025, according to UBP. By the end of July 2026 it was above $65 billion, about seven times higher.
OpenAI’s run rate passed $40 billion on August 13, roughly double its level at the end of 2025. That implies about $20 billion a year earlier. OpenAI also reports ads at about $1 billion annualized.
An earlier report gave different numbers. AI Business Weekly listed Anthropic at $47 billion in May and OpenAI at about $25 billion, and said Anthropic passed OpenAI in April. The later figures show both companies kept growing.
| Company | End of 2025 | Spring 2026 report | Latest |
|---|---|---|---|
| Anthropic | About $9B | $47B (May) | $65B+ (end of July) |
| OpenAI | About $20B (implied) | About $25B | $40B+ (August 13) |
Axios adds a warning that applies to every comparison here: the two companies may not measure revenue the same way. Run rates also depend on which month is used and how usage-based sales are counted. The ranking is clear, but the exact gap is not.
Anthropic Revenue Statistics
Anthropic’s growth came mostly from business customers. AI Business Weekly reports that 70% of Fortune 100 companies are customers, along with 8 of the Fortune 10. It also lists a 13% paid conversion rate, the highest among major AI platforms.
Funding grew along with sales. Anthropic’s Series H in May 2026 valued the company at $965 billion. Sensor Tower counts 245 million monthly active users.
Consumer use is smaller than business use. Pew finds 6% of US adults use Claude, compared with 44% for ChatGPT. Similarweb puts Claude at 8.9% of generative AI web traffic in May, about triple a year earlier.
| Anthropic metric | Figure | Source |
|---|---|---|
| Run rate, end of 2025 | About $9B | UBP |
| Run rate, end of July 2026 | $65B+ | Bloomberg via Axios |
| Valuation (Series H) | $965B | AI Business Weekly |
| Fortune 100 customers | 70% | AI Business Weekly |
| Share of paying US firms | 43.8% | Ramp |
| US adults who use Claude | 6% | Pew |
| Web traffic share, May 2026 | 8.9% | Similarweb |
Business spending tells a different story. Ramp’s card data shows 43.8% of paying US businesses use Anthropic, compared with 39.8% for OpenAI. In its first month, the Fable 5 model made up 6% of Anthropic tokens but 11.4% of its spend.
That pattern suggests customers pay more for the top model when the task needs it. Ramp’s lead economist read it as an upper limit on what businesses will pay for extra performance. It also shows that revenue can grow faster than user counts.
OpenAI Revenue Statistics
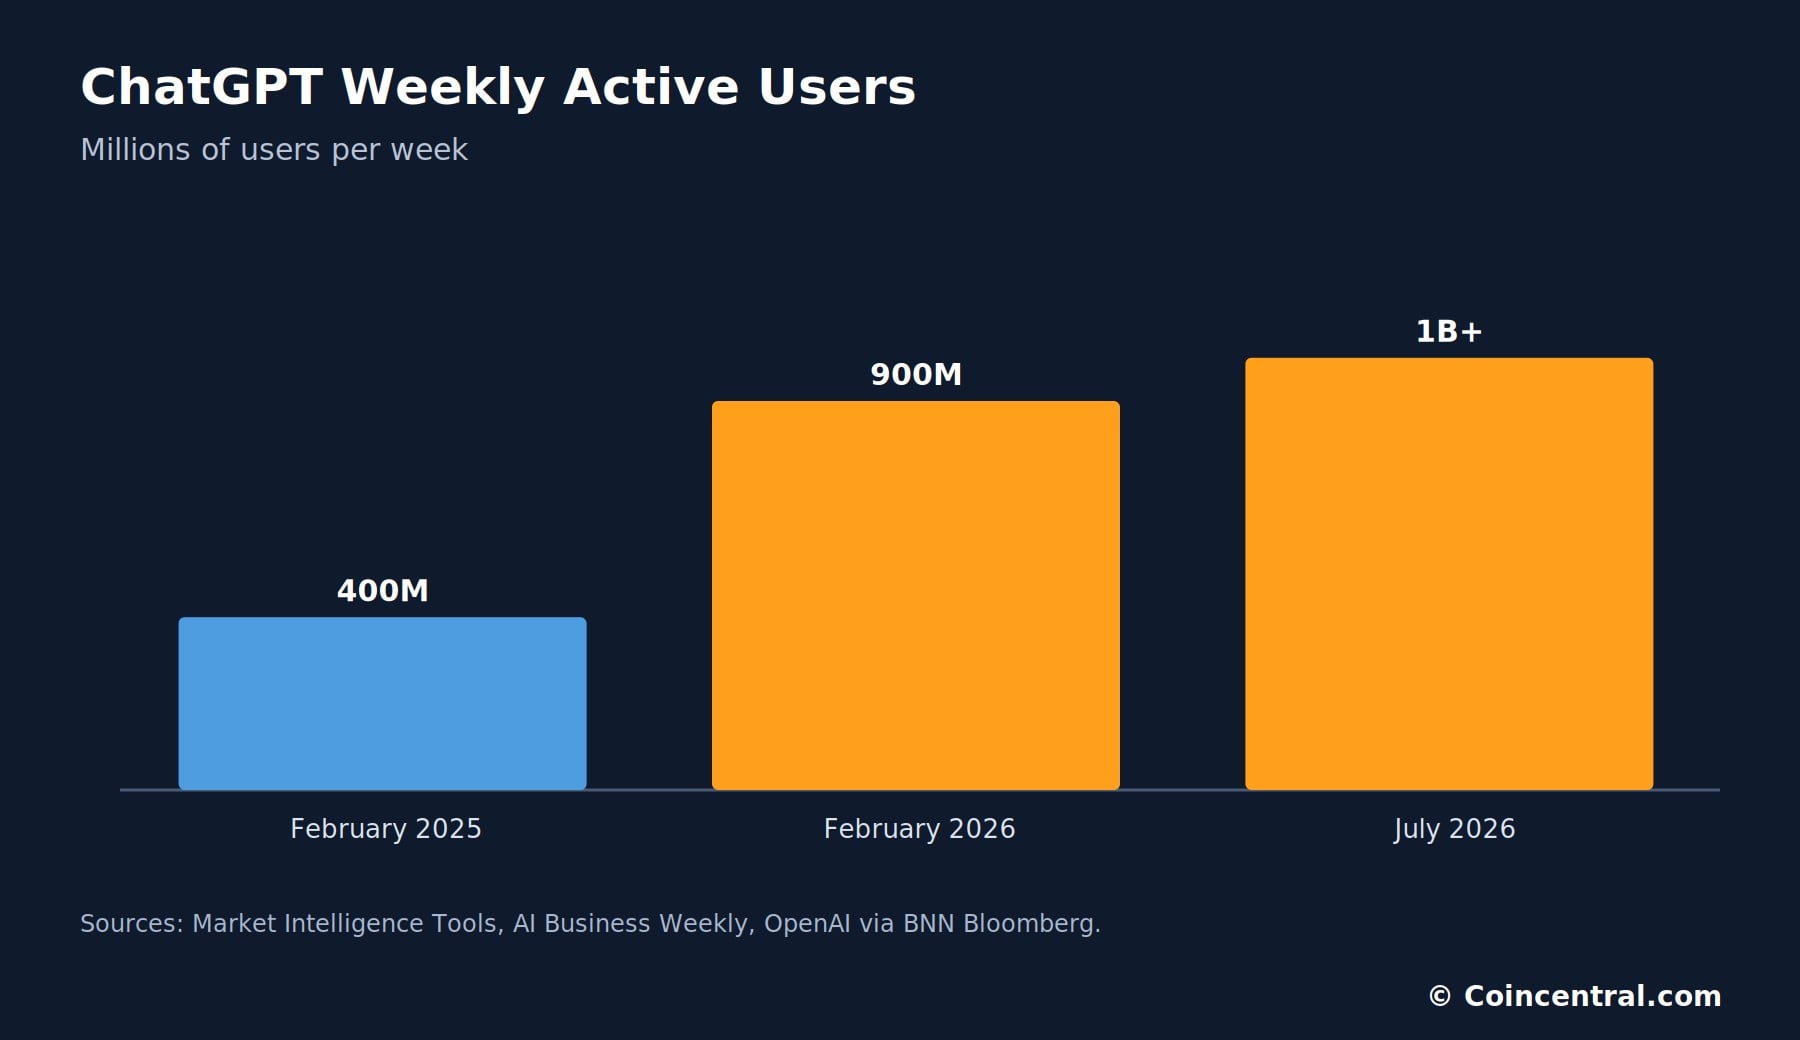
ChatGPT passed 1 billion weekly users in July 2026, up from 900 million in February. In February 2025 it had 400 million. The Next Web notes the milestone came about seven months later than OpenAI’s own target.
ChatGPT still leads in consumer use. Pew finds 44% of US adults use it. Its share of generative AI web traffic fell from about 76% a year earlier to 52.7% in May 2026, as Gemini and Claude gained.
Ads are a new revenue source but a small one, at about $1 billion annualized against a $40 billion run rate. ChatGPT Enterprise output tokens rose 7 times between June 2025 and March 2026, per Fortune. The same OpenAI paper found no link between AI use and revenue per employee.
The Stargate program with SoftBank and Oracle plans $500 billion in infrastructure investment. UBP notes that doubts remain about the profit outlook for base models, especially at OpenAI. Revenue is rising fast, but the sources reviewed here give no profit figures.
Google Revenue Statistics
Google’s AI revenue shows up mostly inside Google Cloud. Cloud revenue was $20 billion in the first quarter of 2026, up 63%. In the second quarter it reached $24.8 billion.
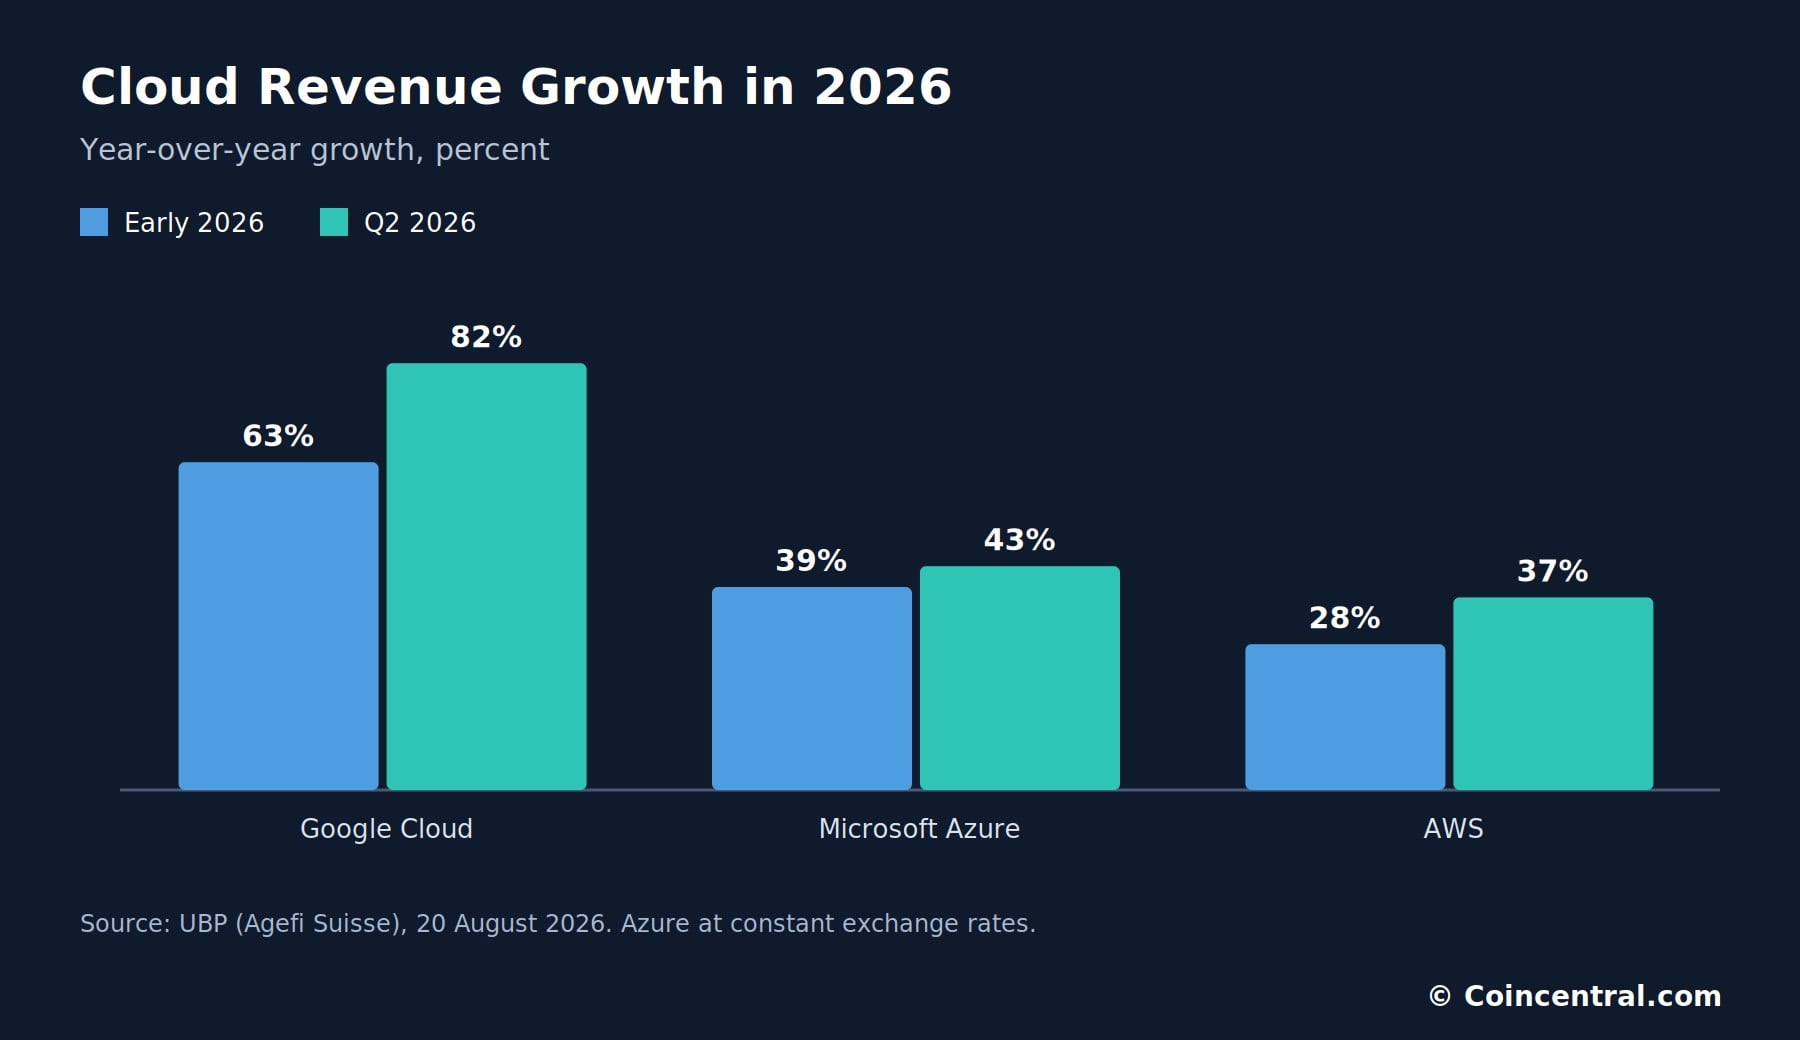
UBP reports Google Cloud’s growth rate rose from 63% to 82% over the first half. Microsoft Azure’s rose from 39% to 43% at constant exchange rates. AWS went from 28% to 37%.
Google’s growth rate is the highest of the three. UBP names AI as an increasingly large driver of that growth. Cloud segments also include many non-AI services, so the figures are not pure AI revenue.
The Gemini app had 1 billion or more monthly users as of August 11, per Google. Reach is higher, at about 2 billion monthly when AI Overviews are counted, based on a May figure. Gemini holds 27.3% of generative AI web traffic.
Google also reports more than 120,000 enterprise customers and a multi-year deal to power Apple’s next Siri, per AI Business Weekly. The sources list Gemini as part of Alphabet, with no separate sales figure. Alphabet raised its 2026 capital spending range to $195 billion to $205 billion.
Microsoft, Amazon and Nvidia: Cloud and Chip Revenue
Amazon Web Services earned $42.2 billion in the second quarter, up 37%. UBP puts its annualized revenue at $169 billion. Amazon said its AI and chips businesses each passed a $25 billion annual run rate, though the two may overlap.
Microsoft Cloud brought in $59.3 billion in the quarter. Satya Nadella said Azure revenue passed $100 billion for the first time in fiscal 2026. Microsoft 365 Copilot reached over 30 million paid seats, up from 15 million at the end of 2025.
Copilot seats are about 6.5% of Microsoft 365 commercial licenses, per UBP. That leaves room to grow. Pew finds 17% of US adults use Copilot, compared with 44% for ChatGPT.
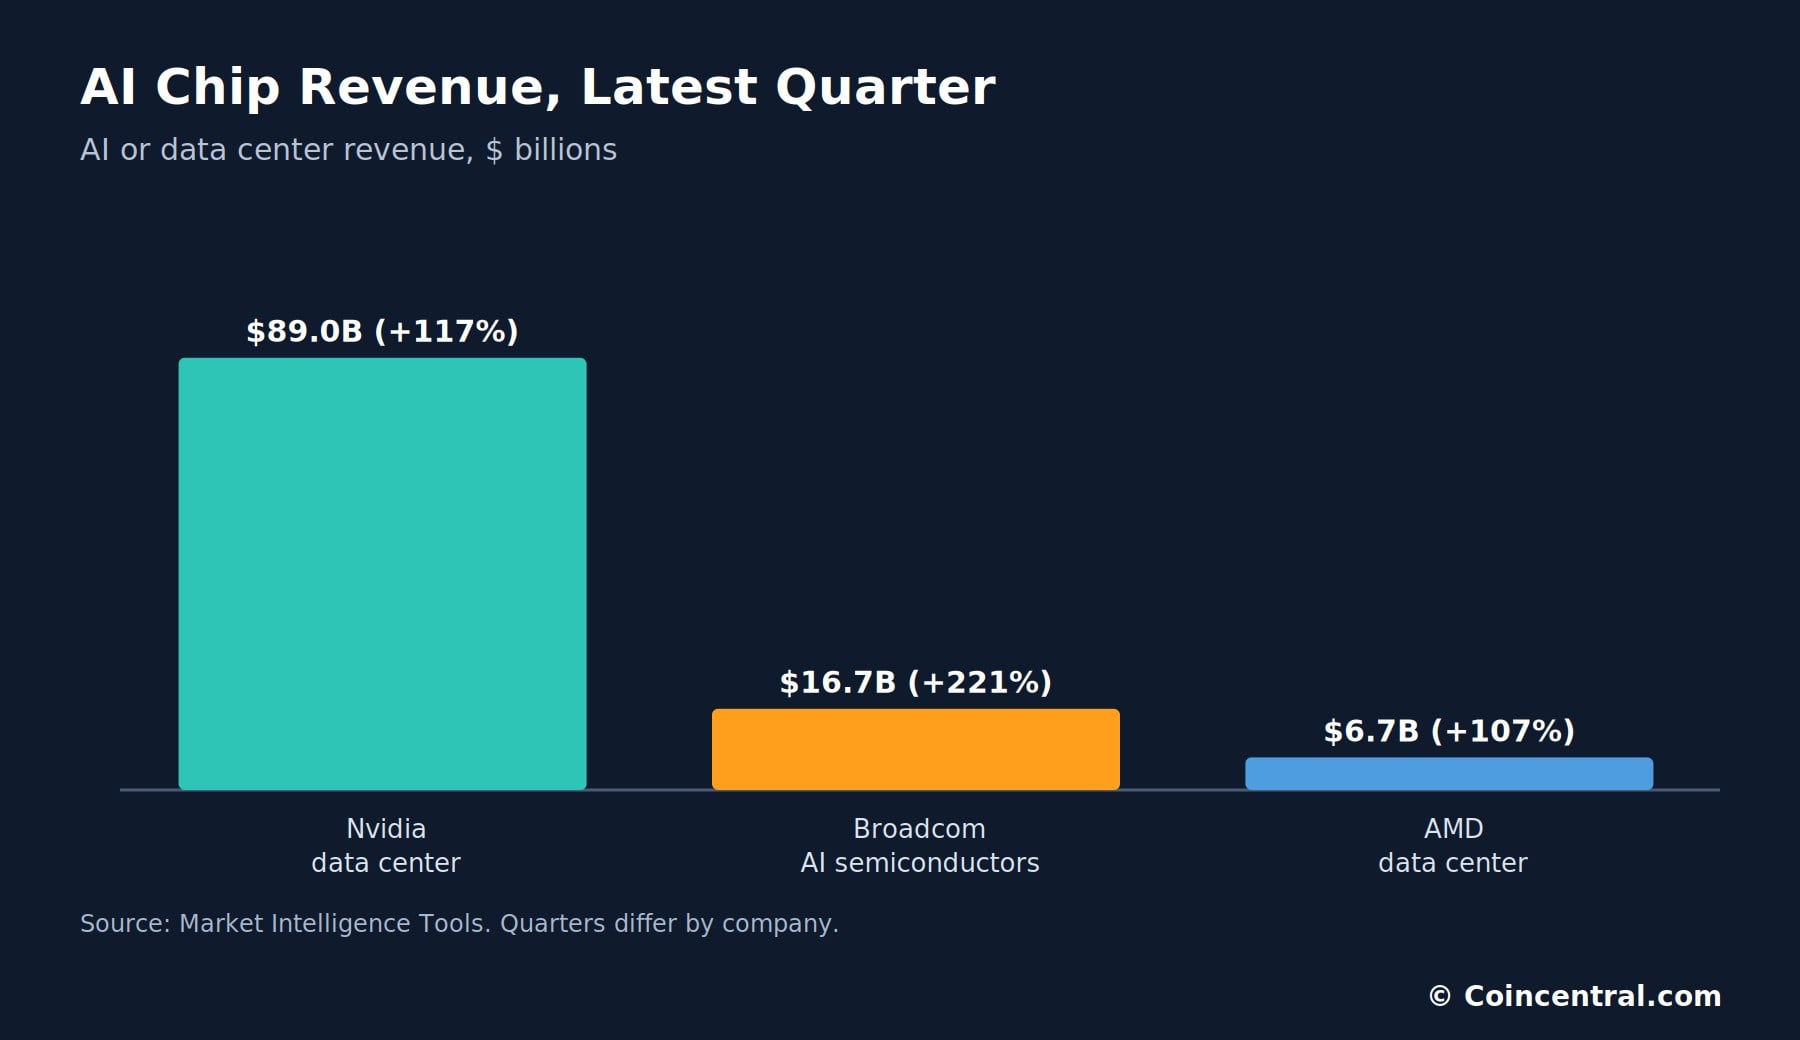
Chip makers sit at the base of the stack. Nvidia reported $96.2 billion in total revenue for its second fiscal quarter of 2027, up 106%. Data center revenue was $89.0 billion, about 13 times AMD’s $6.7 billion.
| Company | AI or data center revenue | Growth | Total revenue |
|---|---|---|---|
| Nvidia (Q2 FY27) | $89.0B | +117% | $96.2B |
| Broadcom (Q3 FY26) | $16.7B | +221% | Not listed |
| AMD (Q2 2026) | $6.7B | +107% | $11.5B |
Broadcom expects $21.7 billion of AI semiconductor revenue next quarter. Nvidia guided $108.0 billion for its next quarter, with no China data center revenue included. For its full fiscal year 2026, Nvidia reported $215.9 billion.
Users vs Revenue: Who Has the Audience and Who Has the Sales
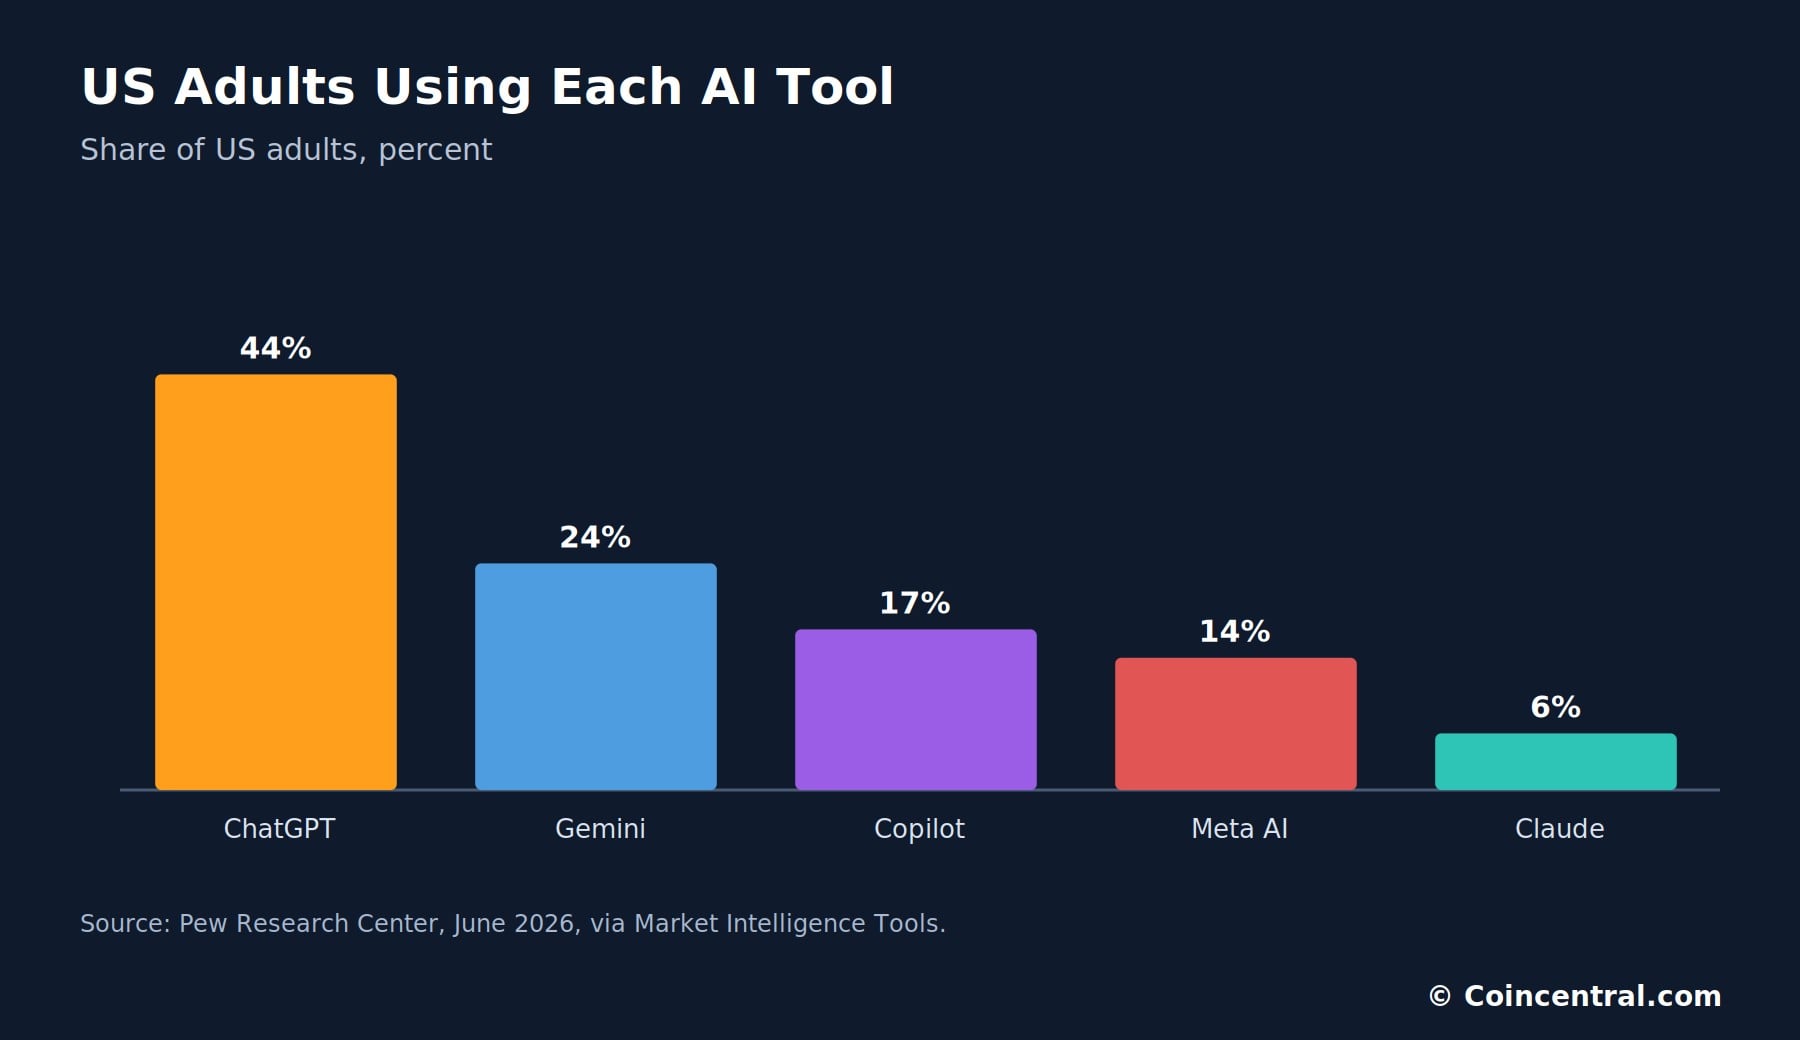
User counts and revenue do not line up. Pew finds 44% of US adults use ChatGPT, 24% use Gemini, 17% use Copilot, 14% use Meta AI and 6% use Claude. Yet Anthropic reports the larger run rate.
One reason is that businesses pay for API access, enterprise seats and top models, often at larger amounts than individuals. Ramp’s data shows more paying US firms on Anthropic than on OpenAI. Consumer reach and business spending are separate measures.
The user metrics also differ by company. ChatGPT’s 1 billion is weekly users, and Gemini’s is monthly users. Meta’s 1.2 billion monthly users includes passive answers, and Microsoft counts paid seats instead of people.
| Tool | US adults using (Pew) | Web share (May) | Scale reported |
|---|---|---|---|
| ChatGPT | 44% | 52.7% | 1B+ weekly users |
| Gemini | 24% | 27.3% | 1B+ monthly users |
| Microsoft Copilot | 17% | 2.0% | 30M+ paid seats |
| Claude | 6% | 8.9% | $65B+ run rate |
| Meta AI | 14% | Not listed | 1.2B monthly users |
Overall use is broad. Pew finds 49% of US adults use AI chatbots, up from 33% in 2024 and 23% in 2023. Gallup finds 52% of US employees use AI at work, though only 13% use it every day.
Business adoption reads lower in government data. The US Census Bureau counted 19.8% of US businesses using AI in May 2026. Larger firms are higher, at 37% for firms with 250 or more employees.
AI Funding: Who Is Paying for the Race?
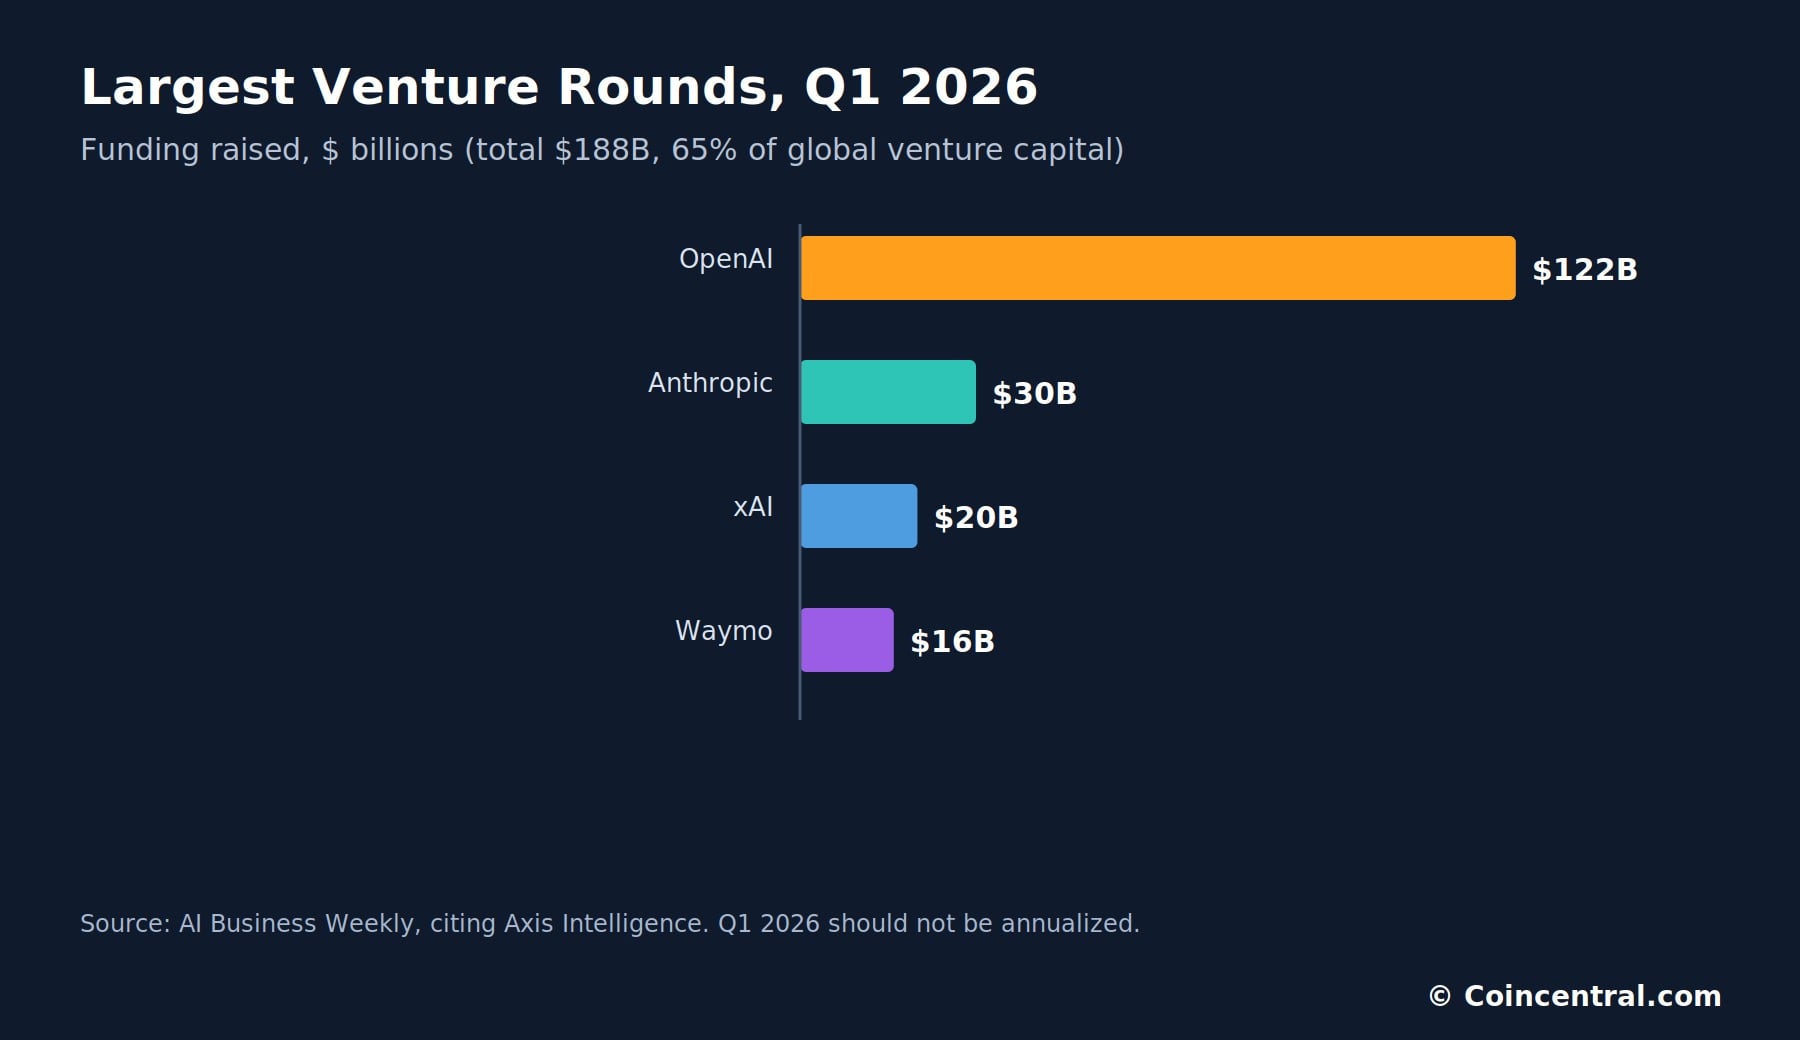
Venture money is flowing to a few companies. AI Business Weekly reports that AI took $242 billion of $300 billion in global venture funding in the first quarter of 2026, or 80%. Four rounds made up $188 billion, or 65% of the global total.
Those rounds were OpenAI at $122 billion, Anthropic at $30 billion, xAI at $20 billion and Waymo at $16 billion. The source warns that the quarter was a concentration event and should not be projected across the year. A few very large rounds drove the total.
For all of 2025, AI startups raised $212 billion, 85% more than in 2024, per Crunchbase. Stanford’s AI Index counts $581.7 billion in global corporate AI investment in 2025, up 130%. It counts $344.7 billion in private investment, of which $285.9 billion was in the US.
The US figure is 23.1 times China’s $12.4 billion, though Stanford says China’s state guidance funds sit outside that count. OpenAI was valued at $852 billion after its round, and Anthropic at $965 billion after its Series H. Valuations are not revenue, but they show what investors expect.
AI Spending vs AI Revenue
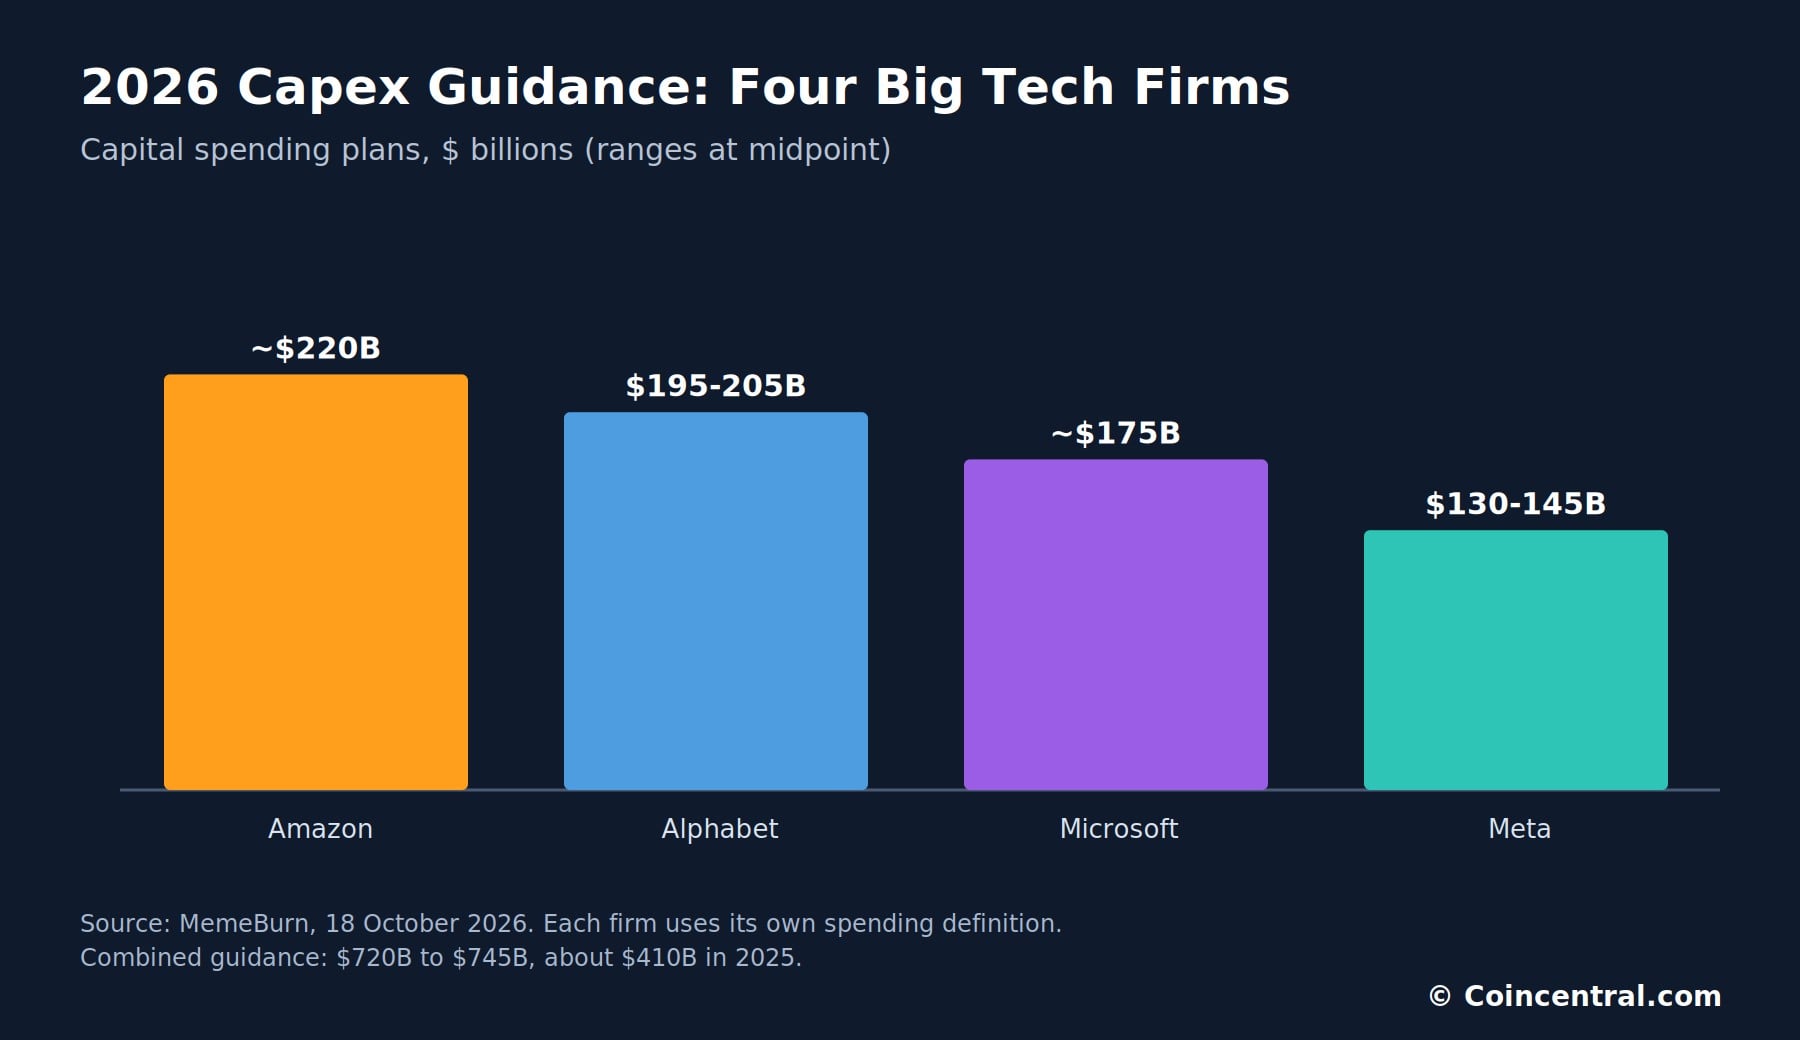
The money going out is large too. Microsoft, Alphabet, Amazon and Meta have guided to $720 billion to $745 billion in 2026 capital spending. The midpoint is $732.5 billion, compared with about $410 billion in 2025.
That is a rise of roughly 76% to 82% from 2025, according to MemeBurn. The figures follow each company’s own definition, so they are not a pure AI measure. They include regular cloud capacity and, at Amazon, its fulfillment network.
| Company | 2025 capex | 2026 guidance | Q2 2026 capex |
|---|---|---|---|
| Amazon | $128.3B | About $220B | $53.1B |
| Alphabet | $91.4B | $195B to $205B | $44.9B |
| Microsoft | $118.0B | About $175B | $41.0B |
| Meta | $72.2B | $130B to $145B | $31.1B |
| Combined | About $410B | $720B to $745B | Not combined |
Cash strain differs by company. In the second quarter, Meta spent 49.5% of revenue on property and equipment, Microsoft 39.8%, Alphabet 37.5% and Amazon 27.0%. Meta kept just $784 million of free cash flow after capital spending, and Amazon had a $7.6 billion free cash outflow over 12 months.
Borrowing is filling part of the gap. Reuters found that Amazon, Alphabet, Meta and Oracle issued about $194 billion of bonds through July 7, up from $108 billion in all of 2025. Alphabet also raised $49.6 billion in net equity in the first half.
Higher prices explain part of the increase. Microsoft said $25 billion of its earlier $190 billion plan came from higher component costs. Amazon tied part of its move from $200 billion to $220 billion to memory prices.
The effect reaches the wider economy. ING counts data center, software and information processing investment at 50.2% of US GDP growth in the second quarter. Ramp also saw AI spending per employee at the top 1% of businesses fall 9.7% in August, which it said may be a summer effect.
Is AI Paying Off for Customers?
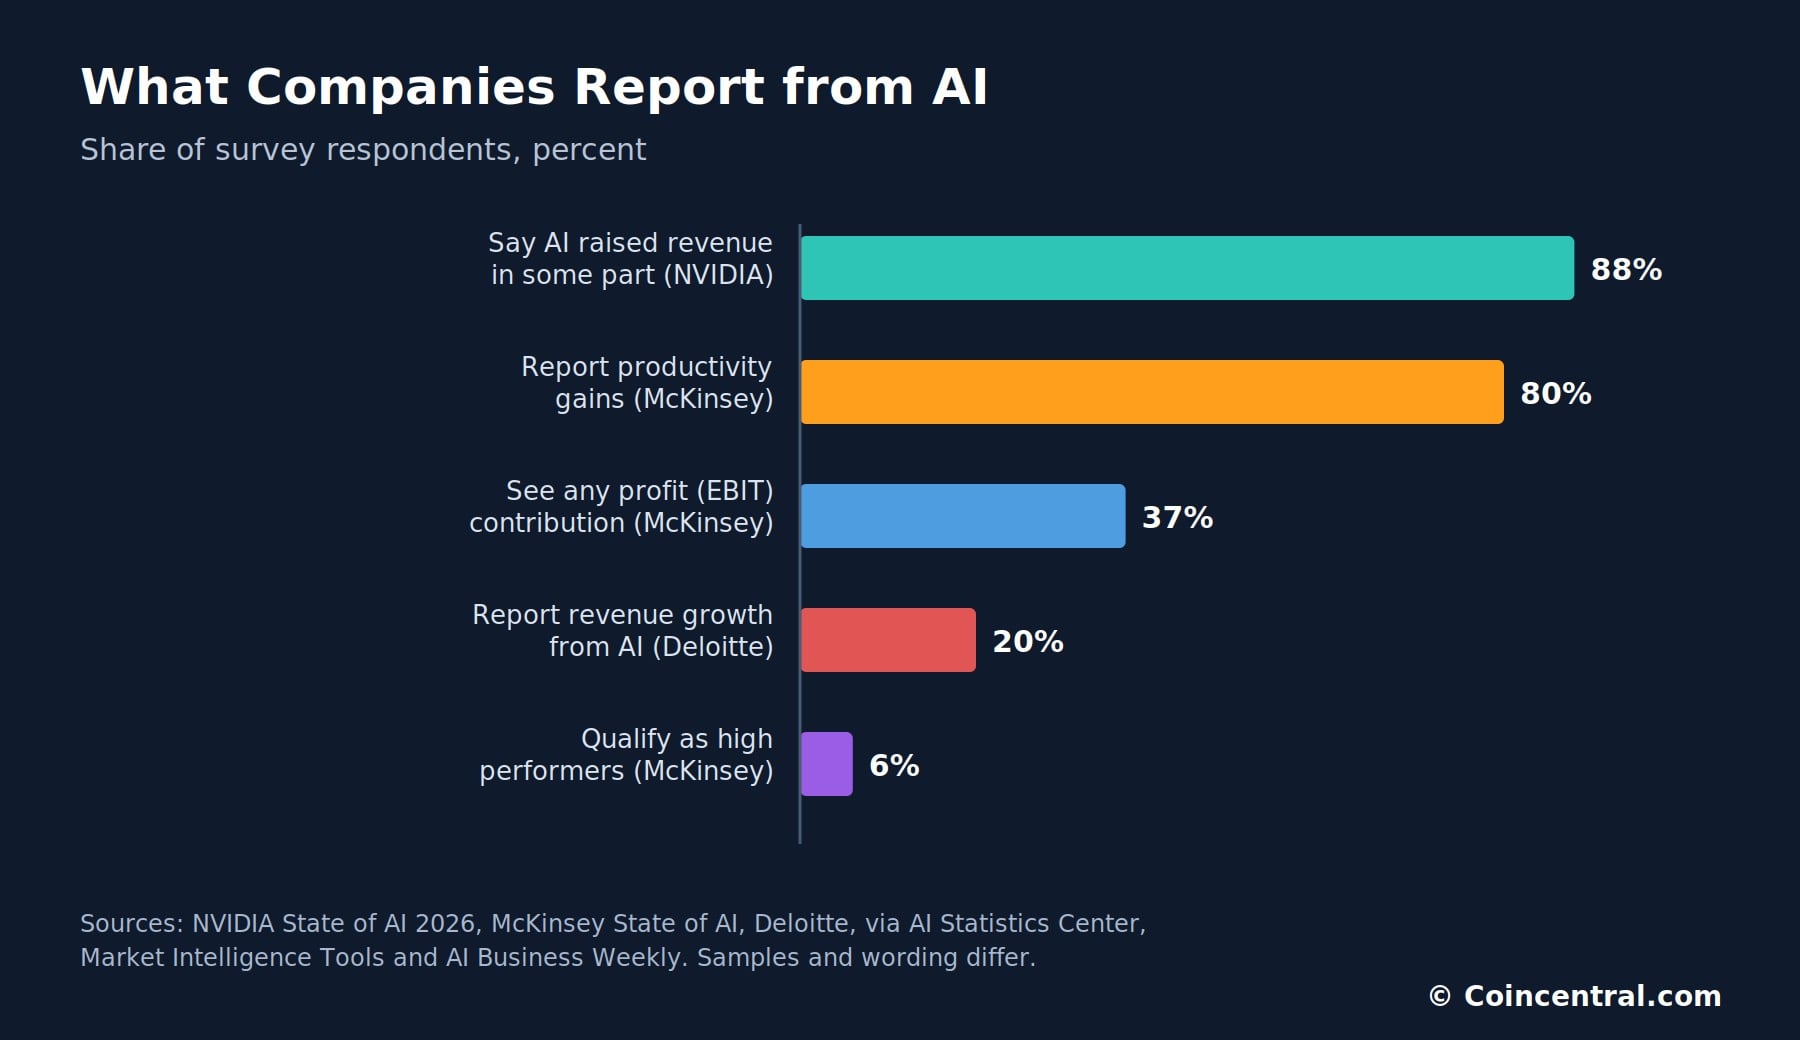
Surveys give mixed answers. NVIDIA’s survey of more than 3,200 respondents found 88% say AI increased annual revenue in some or all parts of the business. Thirty percent report gains above 10%, and 33% report gains of 5% to 10%.
McKinsey’s State of AI paints a narrower picture. In it, 80% report a positive effect on productivity, but only 37% see any contribution to earnings before interest and taxes. About 6% qualify as high performers, and 44% say AI is scaling across the enterprise.
Other surveys fall in between. Deloitte finds 20% of organizations report revenue growth from AI. S&P Global says 46% of AI initiatives are on track for positive returns within 12 months, and 37% are live and delivering value.
MIT and NBER research found 95% of generative AI pilots delivered no measurable profit and loss impact. Question wording and sample size can explain part of the spread. A firm can see AI help one team and still see no change in total profit.
Some studies find strong returns for mature programs. IDC and Microsoft put the average return at $3.70 per dollar spent on generative AI, and Accenture reports $4.60 for mature programs. Those figures depend on how each study counts benefits.
What the Revenue Numbers Show
AI revenue is growing quickly at the model makers, the cloud providers and the chip makers. Anthropic and OpenAI have run rates above $65 billion and $40 billion. Nvidia’s data center sales alone were $89.0 billion in one quarter.
The returns for customers are less clear. Most firms report some benefit, but fewer report a clear effect on profit. Spending plans of $720 billion to $745 billion mean revenue has to keep climbing.
Capital Economics has said conditions look consistent with a late-stage bubble, while Nvidia’s CEO says demand is accelerating. The next data points arrive soon. Meta reports on October 21, Alphabet and Microsoft on October 28, and Amazon on October 29.
Readers who cite these numbers should note the date and the measure. A run rate, a quarter of sales and a full year of revenue are three different things.
Sources
- AI Statistics 2026: Market Size, Users, Adoption & Impact (AI Business Weekly)
- AI Spending Statistics 2026 Show Big Tech’s $733B Bet (MemeBurn)
- What percentage of companies increase revenue with AI? (AI Statistics Center)
- AI starts showing signs of profitability (UBP, from Agefi Suisse)
- AI statistics for 2026: OpenAI has the users, Anthropic has the money (Market Intelligence Tools)
The post AI Revenue Statistics 2026: How Much Money Are OpenAI, Anthropic and Google Making? appeared first on Blockonomi.
This articles is written by : Nermeen Nabil Khear Abdelmalak
All rights reserved to : USAGOLDMIES . www.usagoldmines.com
You can Enjoy surfing our website categories and read more content in many fields you may like .
Why USAGoldMines ?
USAGoldMines is a comprehensive website offering the latest in financial, crypto, and technical news. With specialized sections for each category, it provides readers with up-to-date market insights, investment trends, and technological advancements, making it a valuable resource for investors and enthusiasts in the fast-paced financial world.