TLDR
- BNB reached a milestone of 500 million unique addresses, marking unprecedented network growth and potentially indicating increased adoption and future price movement
- Spot trading data shows $117.84 million worth of BNB purchased between January 27th and current date, with negative exchange netflow suggesting strong buying pressure
- Derivative traders show bullish sentiment with a 2.369 long-to-short ratio on Binance, indicating more buyers than sellers in the market
- Technical analysis shows BNB trading near $605.90 support level with potential upward movement target of $793.86
- Parabolic SAR indicator suggests bullish momentum with dots forming below the current price level
The BNB blockchain has achieved a major milestone, reaching 500 million unique addresses as buying pressure increases across spot and derivatives markets. Data from BscScan shows this new all-time high in network addresses coincides with growing trading volume and positive market indicators.
On-chain data reveals that the total number of unique addresses on the BNB Chain crossed the 500 million mark within the past 24 hours. This metric represents the total number of distinct wallet addresses that have interacted with the network since its inception, providing a measure of the network’s overall adoption and usage.
Trading activity on major exchanges shows increasing buy-side pressure for BNB tokens. Between January 27th and the current date, traders have purchased approximately $117.84 million worth of BNB, according to data from Coinglass. This sustained buying activity is reflected in exchange netflow data, which has turned negative, typically indicating that traders are moving their holdings from exchanges to private wallets rather than preparing to sell.
The derivatives market mirrors this optimistic outlook, with Binance’s top derivative traders showing particular confidence in BNB’s near-term prospects. The long-to-short ratio, which measures the relationship between buyers and sellers in the derivatives market, currently stands at 2.369. This metric suggests that derivative traders are positioning themselves for potential upward price movement, as values above 1 indicate more buyers than sellers in the market.
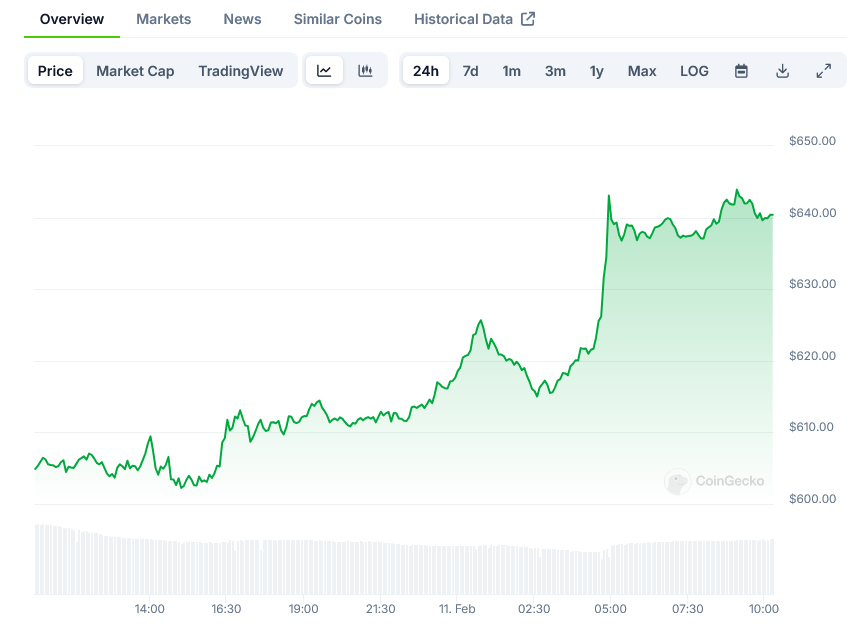
Recent price action shows BNB trading near a key support level of $605.90, despite a 4.53% decline in the past 24 hours. Technical analysis indicates this price level could serve as a foundation for future price movement, with charts showing a potential upward target of $793.86.

The Parabolic SAR indicator, a technical tool used to identify potential trend reversals, currently displays dots below the price line. This formation traditionally signals upward momentum in the asset’s price action, adding another bullish indicator to the technical outlook.
Trading volume across major exchanges has remained steady, with consistent activity seen in both spot and derivatives markets. This sustained trading activity suggests ongoing market interest in BNB despite recent price fluctuations.
Data from multiple exchanges shows a pattern of accumulation, with traders moving BNB tokens off exchanges at an increasing rate. This behavior often precedes periods of reduced selling pressure, as tokens held in private wallets are typically less likely to be immediately sold compared to those held on exchanges.
The current market structure shows BNB maintaining its position above key moving averages, suggesting underlying strength in the price action despite short-term volatility. Trading patterns indicate steady accumulation at current price levels, with support forming around the $605.90 mark.
Exchange data reveals increased institutional interest, with large-volume traders showing notably higher buying activity compared to previous months. This institutional participation often provides more stable price support compared to retail trading activity.
Recent network metrics show healthy transaction volumes, indicating active usage of the BNB Chain for both trading and decentralized application interactions. Daily transaction counts remain robust, suggesting sustained network utility beyond speculative trading.
Order book analysis reveals strong buying support at current price levels, with multiple large bids placed below the current market price. This buying pressure could provide price stability and potential support for upward movement.
Market depth data shows improving liquidity conditions, with tighter bid-ask spreads compared to previous weeks. This increased market efficiency often precedes periods of reduced price volatility.
Technical indicators beyond the Parabolic SAR show convergence of multiple bullish signals, including positive momentum readings and favorable moving average alignments. These technical factors align with the positive sentiment seen in trading data.
The most recent data shows continued growth in unique addresses, with the 500 million milestone representing a 25% increase from the previous quarter’s figures. This network growth occurs alongside sustained trading activity across major exchanges.
The post Binance Coin (BNB) Price: Network Activity Reaches All-Time High appeared first on Blockonomi.
This articles is written by : Nermeen Nabil Khear Abdelmalak
All rights reserved to : USAGOLDMIES . www.usagoldmines.com
You can Enjoy surfing our website categories and read more content in many fields you may like .
Why USAGoldMines ?
USAGoldMines is a comprehensive website offering the latest in financial, crypto, and technical news. With specialized sections for each category, it provides readers with up-to-date market insights, investment trends, and technological advancements, making it a valuable resource for investors and enthusiasts in the fast-paced financial world.