TLDR
- Bitcoin has breached key support levels, indicating a possible slide to $100,000
- BTC fell 6.5% in August, ending a four-month winning streak
- U.S.-listed spot ETFs lost $751 million in August
- Technical indicators confirm a bearish shift in momentum
- September has historically been a bearish month for Bitcoin with average returns of -3.49%
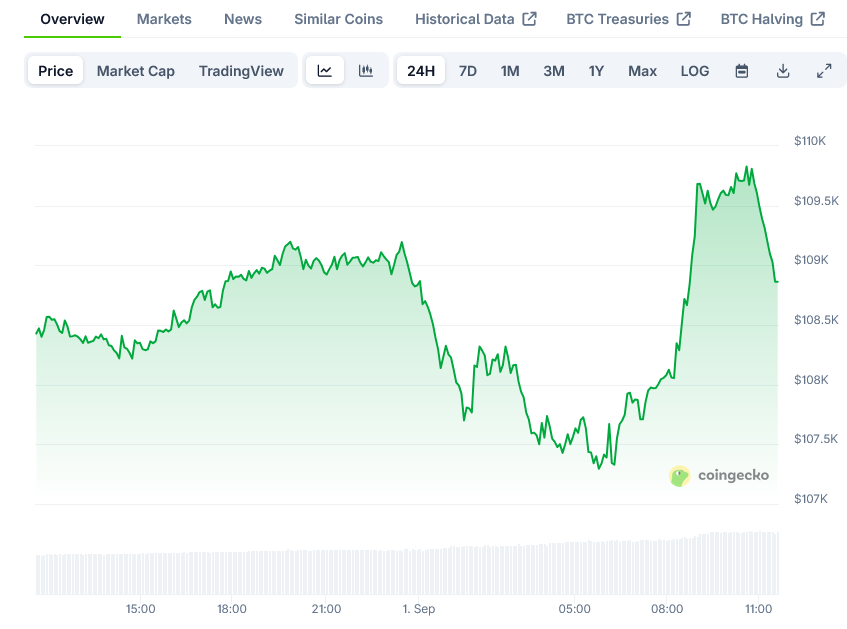
Bitcoin (BTC) has begun September on shaky ground after breaking below several critical support levels, suggesting a potential decline toward the $100,000 mark in the coming weeks. The leading cryptocurrency currently trades at $108,750.62, down from its recent highs as bearish momentum builds.
August proved challenging for Bitcoin as it recorded a 6.5% drop, ending what had been an impressive four-month winning streak. This decline coincided with significant outflows from U.S.-listed spot exchange-traded funds (ETFs), which lost $751 million according to data from SoSoValue.
The recent price action has seen Bitcoin break below multiple key technical indicators. These include the Ichimoku cloud, as well as both the 50-day and 100-day simple moving averages (SMAs).
Bitcoin also fell through important horizontal support zones formed by the May high of $111,965 and the December high of $109,364, as shown on daily charts.
These technical breakdowns point to growing weakness in the market, confirming a bearish shift that is reflected in other momentum indicators.
The Guppy Multiple Moving Average (GMMA) shows the short-term exponential moving average band (green) crossing below the longer-term band (red). This crossover is a clear signal of changing momentum to the downside.
At the same time, the weekly MACD histogram has dropped below zero, indicating a transition from a bullish trend to a bearish one.
JUST IN: Bitcoin addresses holding 100+ BTC reach an all-time high.
Whales are buying at an unprecedented pace.
You know what comes next.
pic.twitter.com/7iH5Vdk3Ym
— Bitcoin Archive (@BTC_Archive) August 30, 2025

Historical September Performance
Adding to the technical concerns is Bitcoin’s historical performance during September. Since 2013, Bitcoin has delivered an average return of -3.49% during this month, closing lower in eight of the past 12 September periods, according to data from Coinglass.
This seasonal weakness aligns with the current technical outlook, potentially amplifying downside risks as traders remain cautious.
For the bearish scenario to be invalidated, Bitcoin would need to overcome the lower high of $113,510 that was set on August 28. Until then, the path of least resistance appears to be downward.
Support and Resistance Levels
The key support levels to watch include $105,240, which represents the 38.2% Fibonacci retracement of the April-August rally. Below that, the 200-day simple moving average sits at $101,366, with the psychologically important $100,000 mark serving as the final major support.

On the upside, resistance can be found at $110,756 (the lower end of the Ichimoku cloud), $113,510 (the recent lower high), and $115,938 (the 50-day SMA).
The technical indicators suggest that Bitcoin may continue its downward trajectory toward the 200-day SMA at $101,366, and possibly test the $100,000 level in the coming weeks.
While Bitcoin remains well above its 2024 starting price, the current technical setup points to a challenging September ahead. Traders are watching closely to see if the cryptocurrency can hold above key support levels or if further selling pressure will push prices lower.
The recent ETF outflows of $751 million mark a shift in institutional sentiment that could continue to weigh on prices in the near term.
The coming days will be crucial in determining whether Bitcoin can regain its footing above key support levels or if the technical breakdown will lead to a deeper correction toward $100,000.
The post Bitcoin (BTC) Price: Technical Breakdown Points to Possible $100,000 Test appeared first on Blockonomi.
This articles is written by : Nermeen Nabil Khear Abdelmalak
All rights reserved to : USAGOLDMIES . www.usagoldmines.com
You can Enjoy surfing our website categories and read more content in many fields you may like .
Why USAGoldMines ?
USAGoldMines is a comprehensive website offering the latest in financial, crypto, and technical news. With specialized sections for each category, it provides readers with up-to-date market insights, investment trends, and technological advancements, making it a valuable resource for investors and enthusiasts in the fast-paced financial world.