TLDR
- Bitcoin experienced a sharp pullback with price dropping to around $110,000
- The flash crash on August 24 was a major long-deleveraging event
- Newer investors (holding less than one month) faced 3.5% unrealized losses
- Key support level at $110,800 representing the Average Cost Basis of 1-3 month holders
- Technical analysis shows Bitcoin in a descending channel with next support at $108,695-$110,000
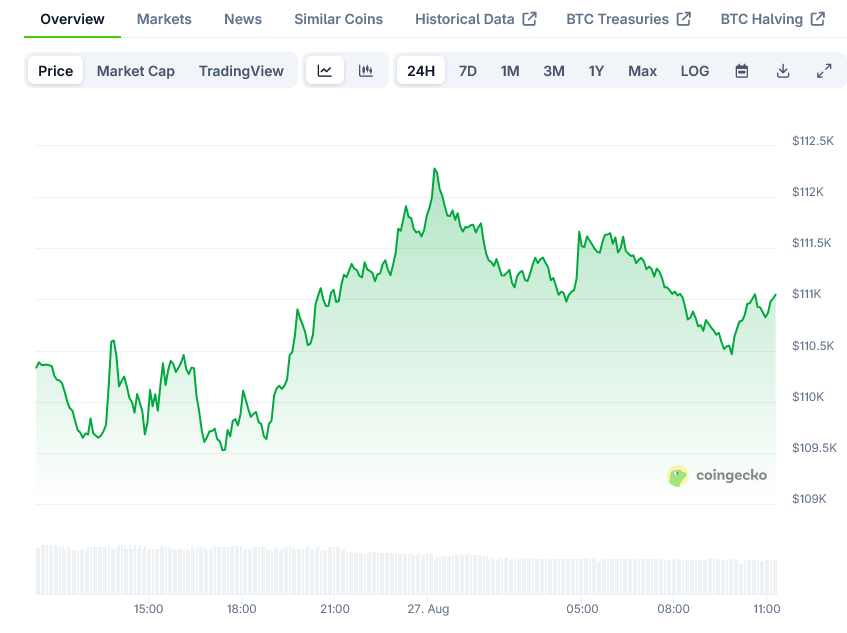
The world’s largest cryptocurrency, Bitcoin (BTC), is currently trading at $110,360, down 1.15% in the last 24 hours, as it tests critical support levels following a sharp price correction. With a market capitalization of $2.19 trillion and nearly 19.9 million BTC in circulation, Bitcoin remains the dominant cryptocurrency despite recent price volatility.
The flash crash on August 24 sent prices tumbling toward $110,000, marking a more severe correction than April’s tariff-driven decline. This recent price action has primarily impacted newer market participants while long-term holders remain steadfast.
Data shows the recent drop triggered significant liquidations, with Long Liquidation Dominance reaching 18% – the highest level in months. This washout of overleveraged positions often serves as a market reset mechanism, potentially creating conditions for a healthier recovery.
On-chain metrics reveal that investors holding Bitcoin for less than one month are experiencing an average unrealized loss of 3.5%, with many choosing to exit their positions. This selling pressure has resulted in a noticeable reduction in supply from this investor cohort.
By contrast, the broader Short-Term Holder (STH) group, those with holdings aged 1-6 months, remain in profit with average gains of 4.5%. Their resilience suggests the current market purge is primarily affecting the newest market entrants.
#Bitcoin is testing key support near $110K after failing to hold $124.4K highs.
Daily chart shows a descending channel, RSI oversold (38), MACD still negative.Break below $108.5K → $105K / $101K
Break above $116.8K → $120.9K / $124K
— Market at a decision point. pic.twitter.com/i7qj3Xsdmr
— Arslan Ali (@forex_arslan) August 26, 2025
Technical Outlook
Bitcoin is currently trapped in a descending price channel after failing to maintain levels above $124,450 earlier this month. The pullback has formed a pattern of lower highs, with price now consolidating around the $110,100 mark.
Several key technical levels are worth monitoring. The 50-day Simple Moving Average at $116,553 is now acting as overhead resistance. A pivot point at $112,000 represents the confluence of a former trendline and support level.
The most critical zone to watch is between $108,695 and $110,000, which serves as the final support floor before deeper corrections become likely. Should this level fail to hold, downside targets include $105,150 and potentially $101,550.

Momentum indicators paint a cautionary picture. The Relative Strength Index (RSI) sits at 38, indicating oversold conditions but showing no bullish divergence yet. The Moving Average Convergence Divergence (MACD) remains negative, suggesting continued downward pressure.
Recent price candles display indecision in the market, with long wicks on both sides indicating a tug-of-war between buyers and sellers.
Market Reset or Deeper Correction?
The current market situation presents two distinct scenarios. If Bitcoin can hold above the support level of $110,800 – which represents the Average Cost Basis for holders of 1-3 months – the market could stabilize, confirming this pullback as a healthy reset rather than the beginning of a more sustained decline.
However, if this support level breaks, historical patterns suggest Bitcoin could face a deeper, more prolonged correction. A decisive drop below $108,695 would validate bearish concerns and potentially accelerate a decline toward the psychologically important $100,000 level.
The setup appears binary: either Bitcoin establishes a base above current support levels and begins climbing back toward previous highs, or a flash crash sends the price into six figures. If bulls can regain control and push above $116,850, the structure favors a return to the $124,000-$130,000 range with renewed momentum.
Despite the current uncertainty, on-chain data suggests this correction is more of a shakeout than a breakdown. Coins are moving from fearful sellers to more resilient holders, which could reduce overhead supply and establish stronger support levels going forward.
For now, Bitcoin is holding just above $110,000, matching the Average Cost Basis for 1-3 month holders. The market’s ability to defend this level in the coming days will likely determine whether this correction represents a healthy market reset or the beginning of a deeper downturn.
The post Bitcoin (BTC) Price: Testing Critical Support at $110,000 After Flash Crash appeared first on Blockonomi.
This articles is written by : Nermeen Nabil Khear Abdelmalak
All rights reserved to : USAGOLDMIES . www.usagoldmines.com
You can Enjoy surfing our website categories and read more content in many fields you may like .
Why USAGoldMines ?
USAGoldMines is a comprehensive website offering the latest in financial, crypto, and technical news. With specialized sections for each category, it provides readers with up-to-date market insights, investment trends, and technological advancements, making it a valuable resource for investors and enthusiasts in the fast-paced financial world.
