Ethereum remains in a corrective, range-bound environment after failing to sustain the early-month advance above the mid-$3,000s. The price action is oscillating between a higher-timeframe demand cluster in the $2,700 region and a broad supply band closer to $3,500, while the main moving averages continue to cap the upside.
This structure keeps directional conviction limited and increases the importance of reaction at the nearby support zones during the current pullback.
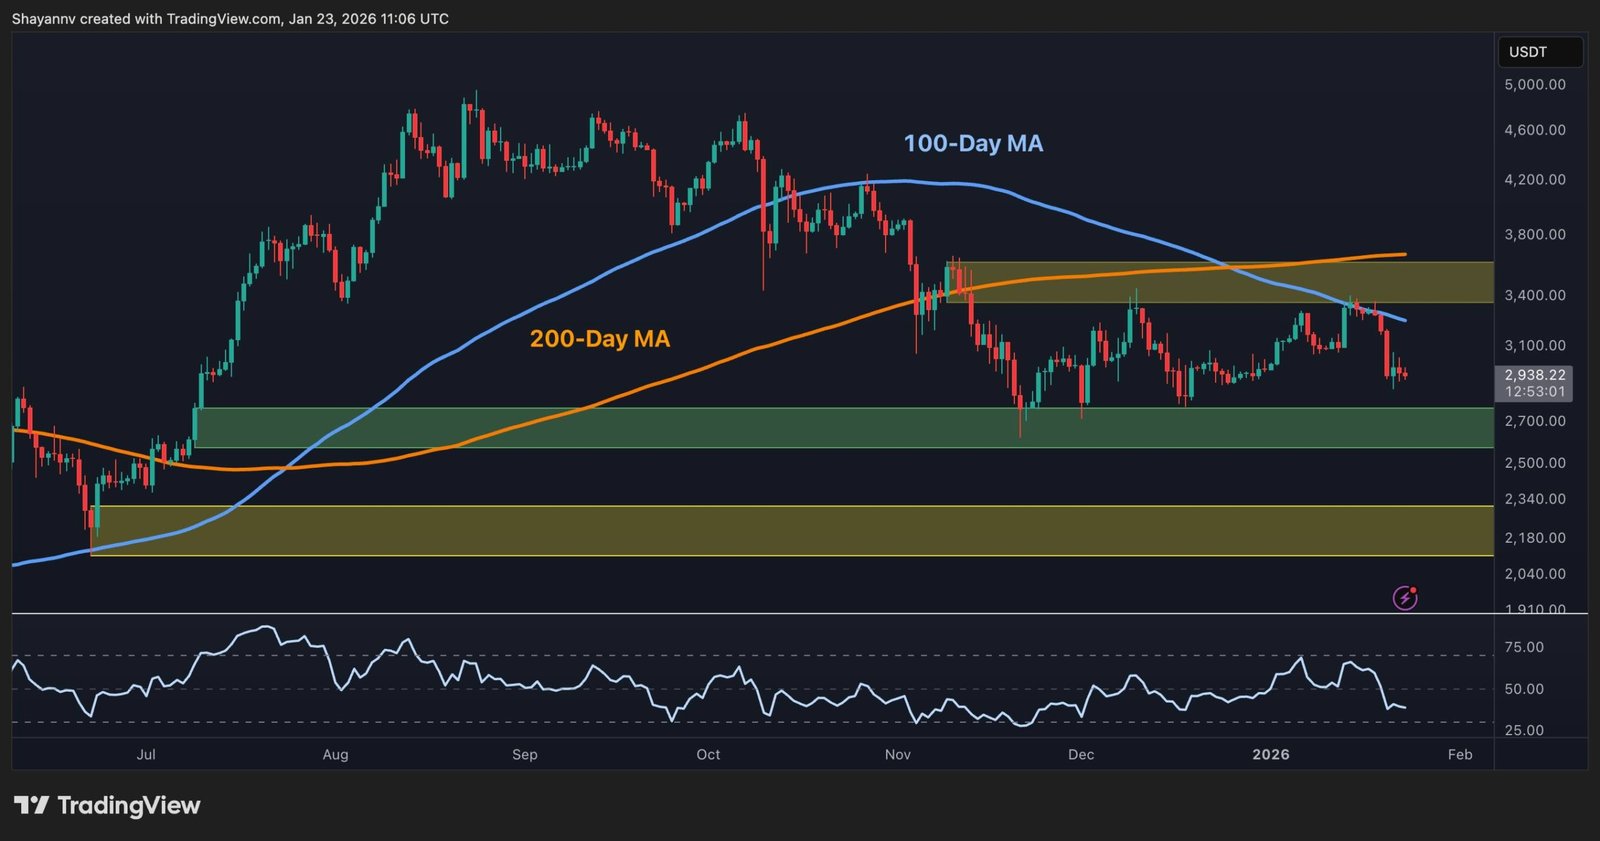
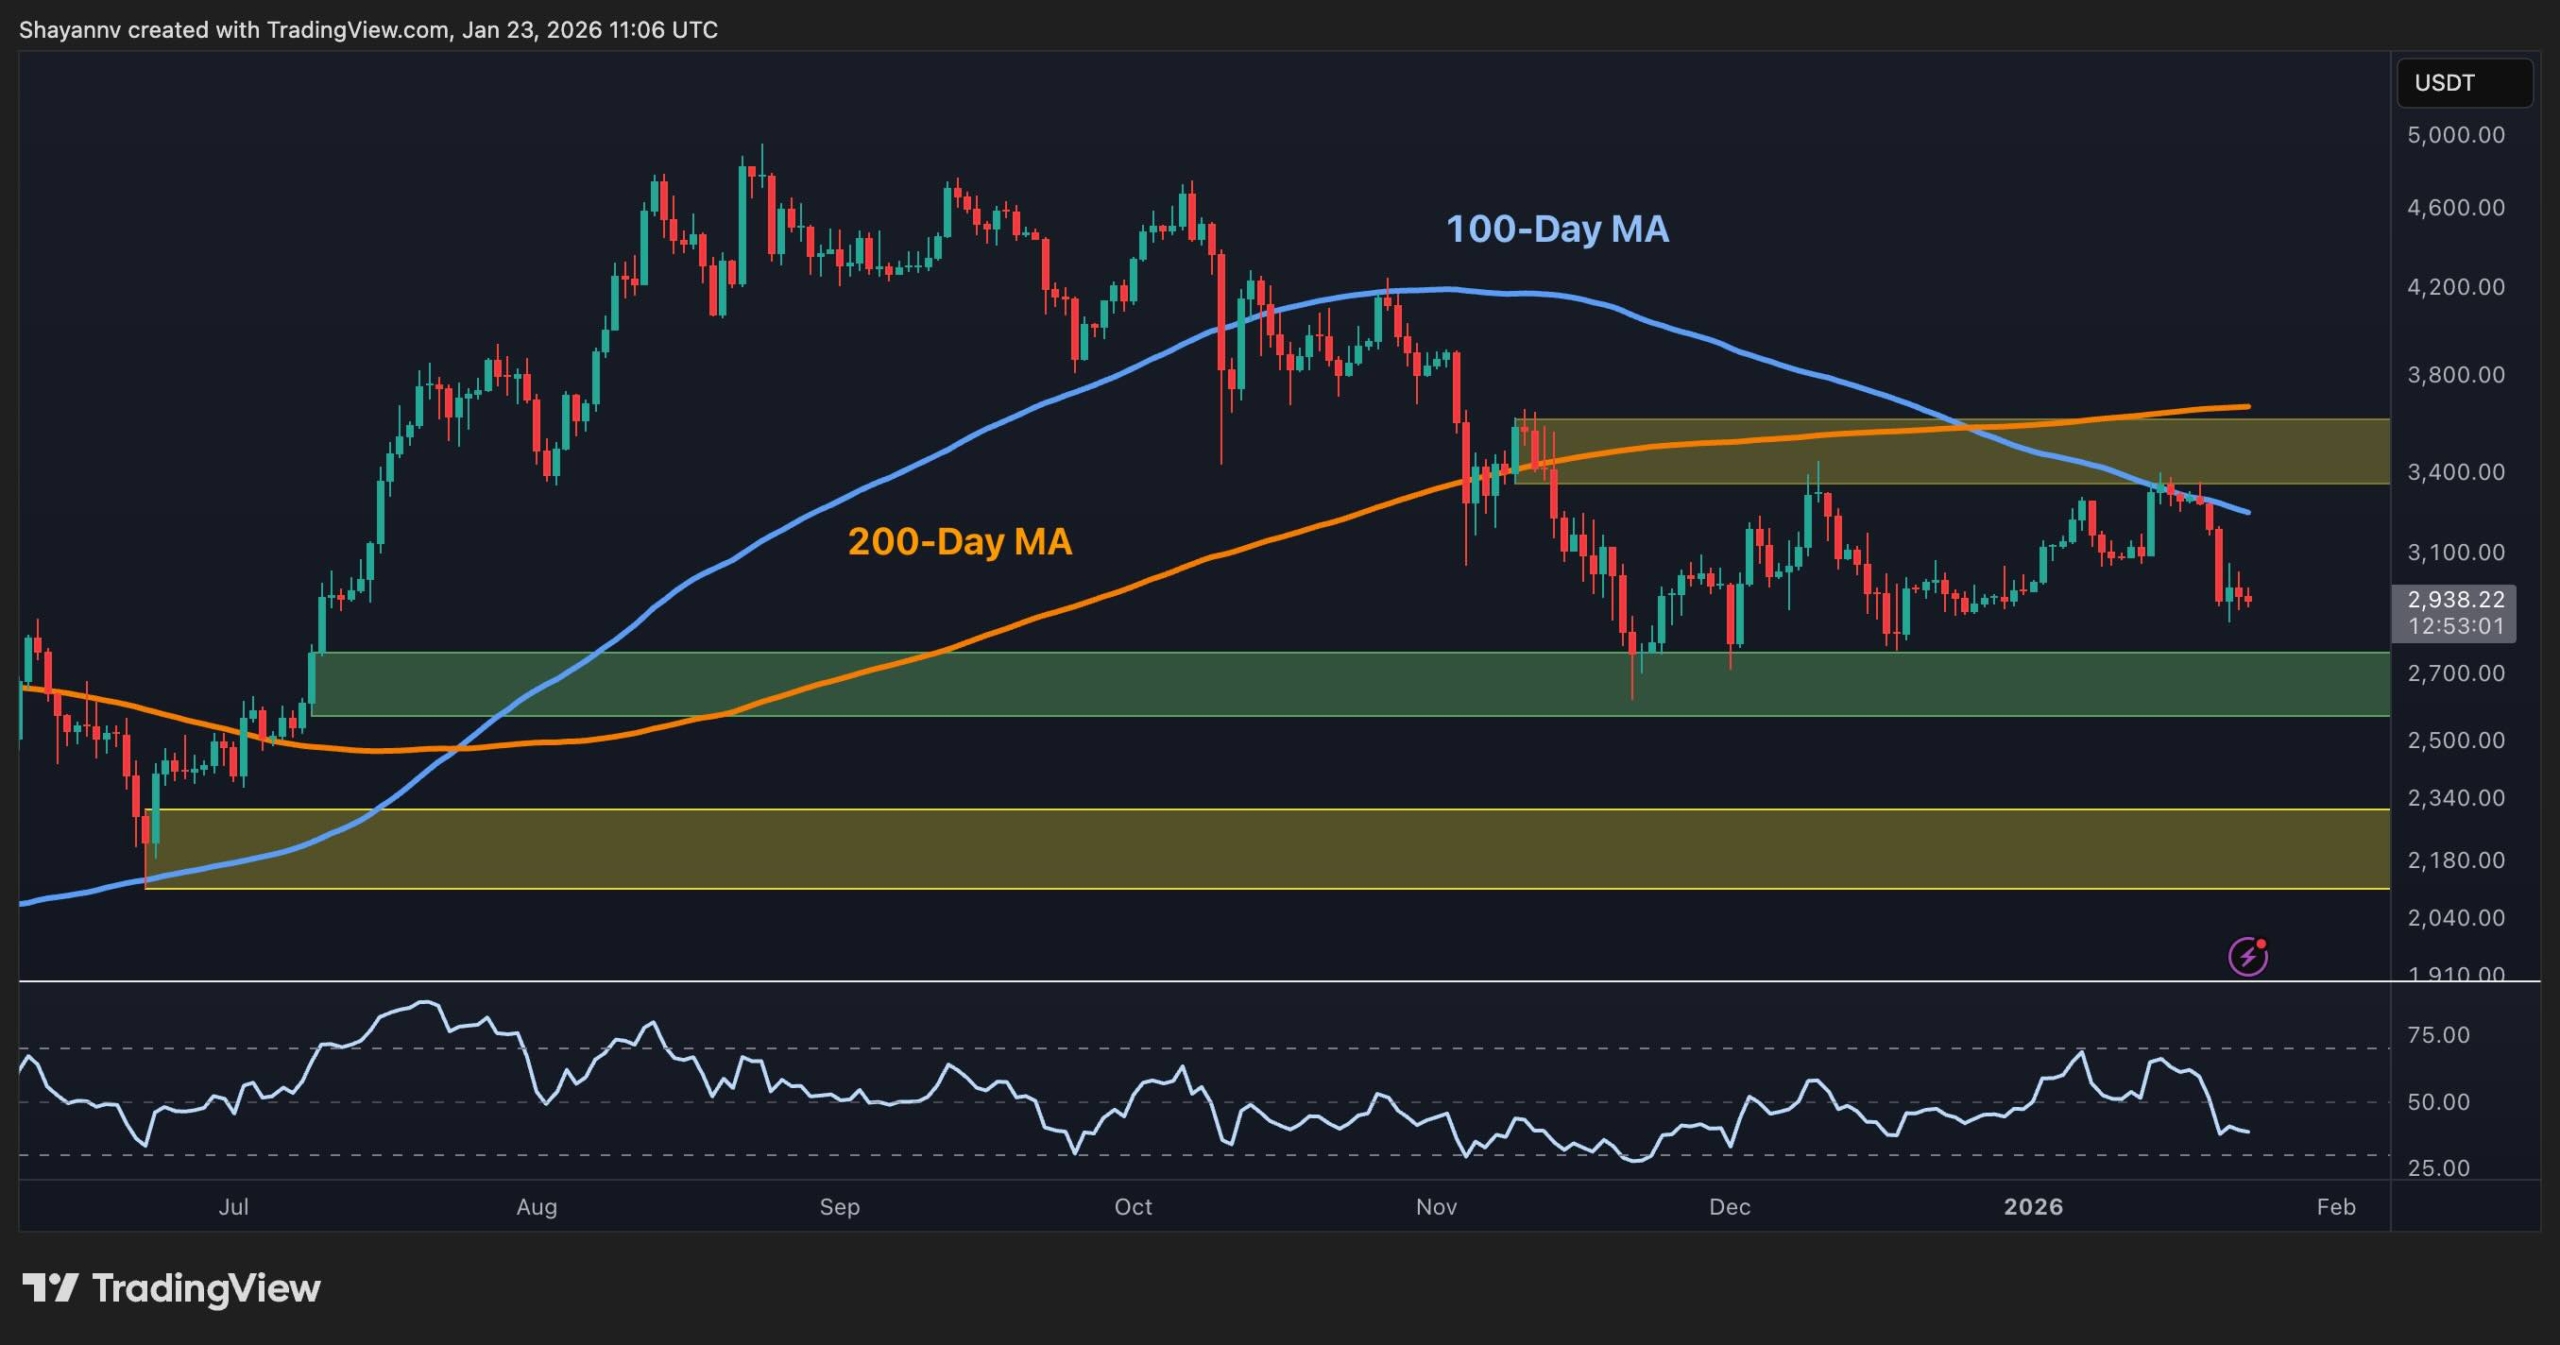
Ethereum Price Analysis: The Daily Chart
On the daily chart, ETH has been rejected once again from the confluence of the $3,500 resistance block and the declining 100-day moving average, with the 200-day still positioned higher around $3,800 and turning sideways. The sell-off back below the 100-day moving average confirms that the primary trend remains corrective rather than impulsively bullish, and the focus shifts to the green $2,700 demand region as the next critical area.
A sustained hold above that zone would prevent a bearish continuation and keep open the possibility of another attempt toward the $3,500 mark. Meanwhile, a daily close below the $2,700 zone would indicate a deeper mean-reversion phase toward the lower support band near $2,200.
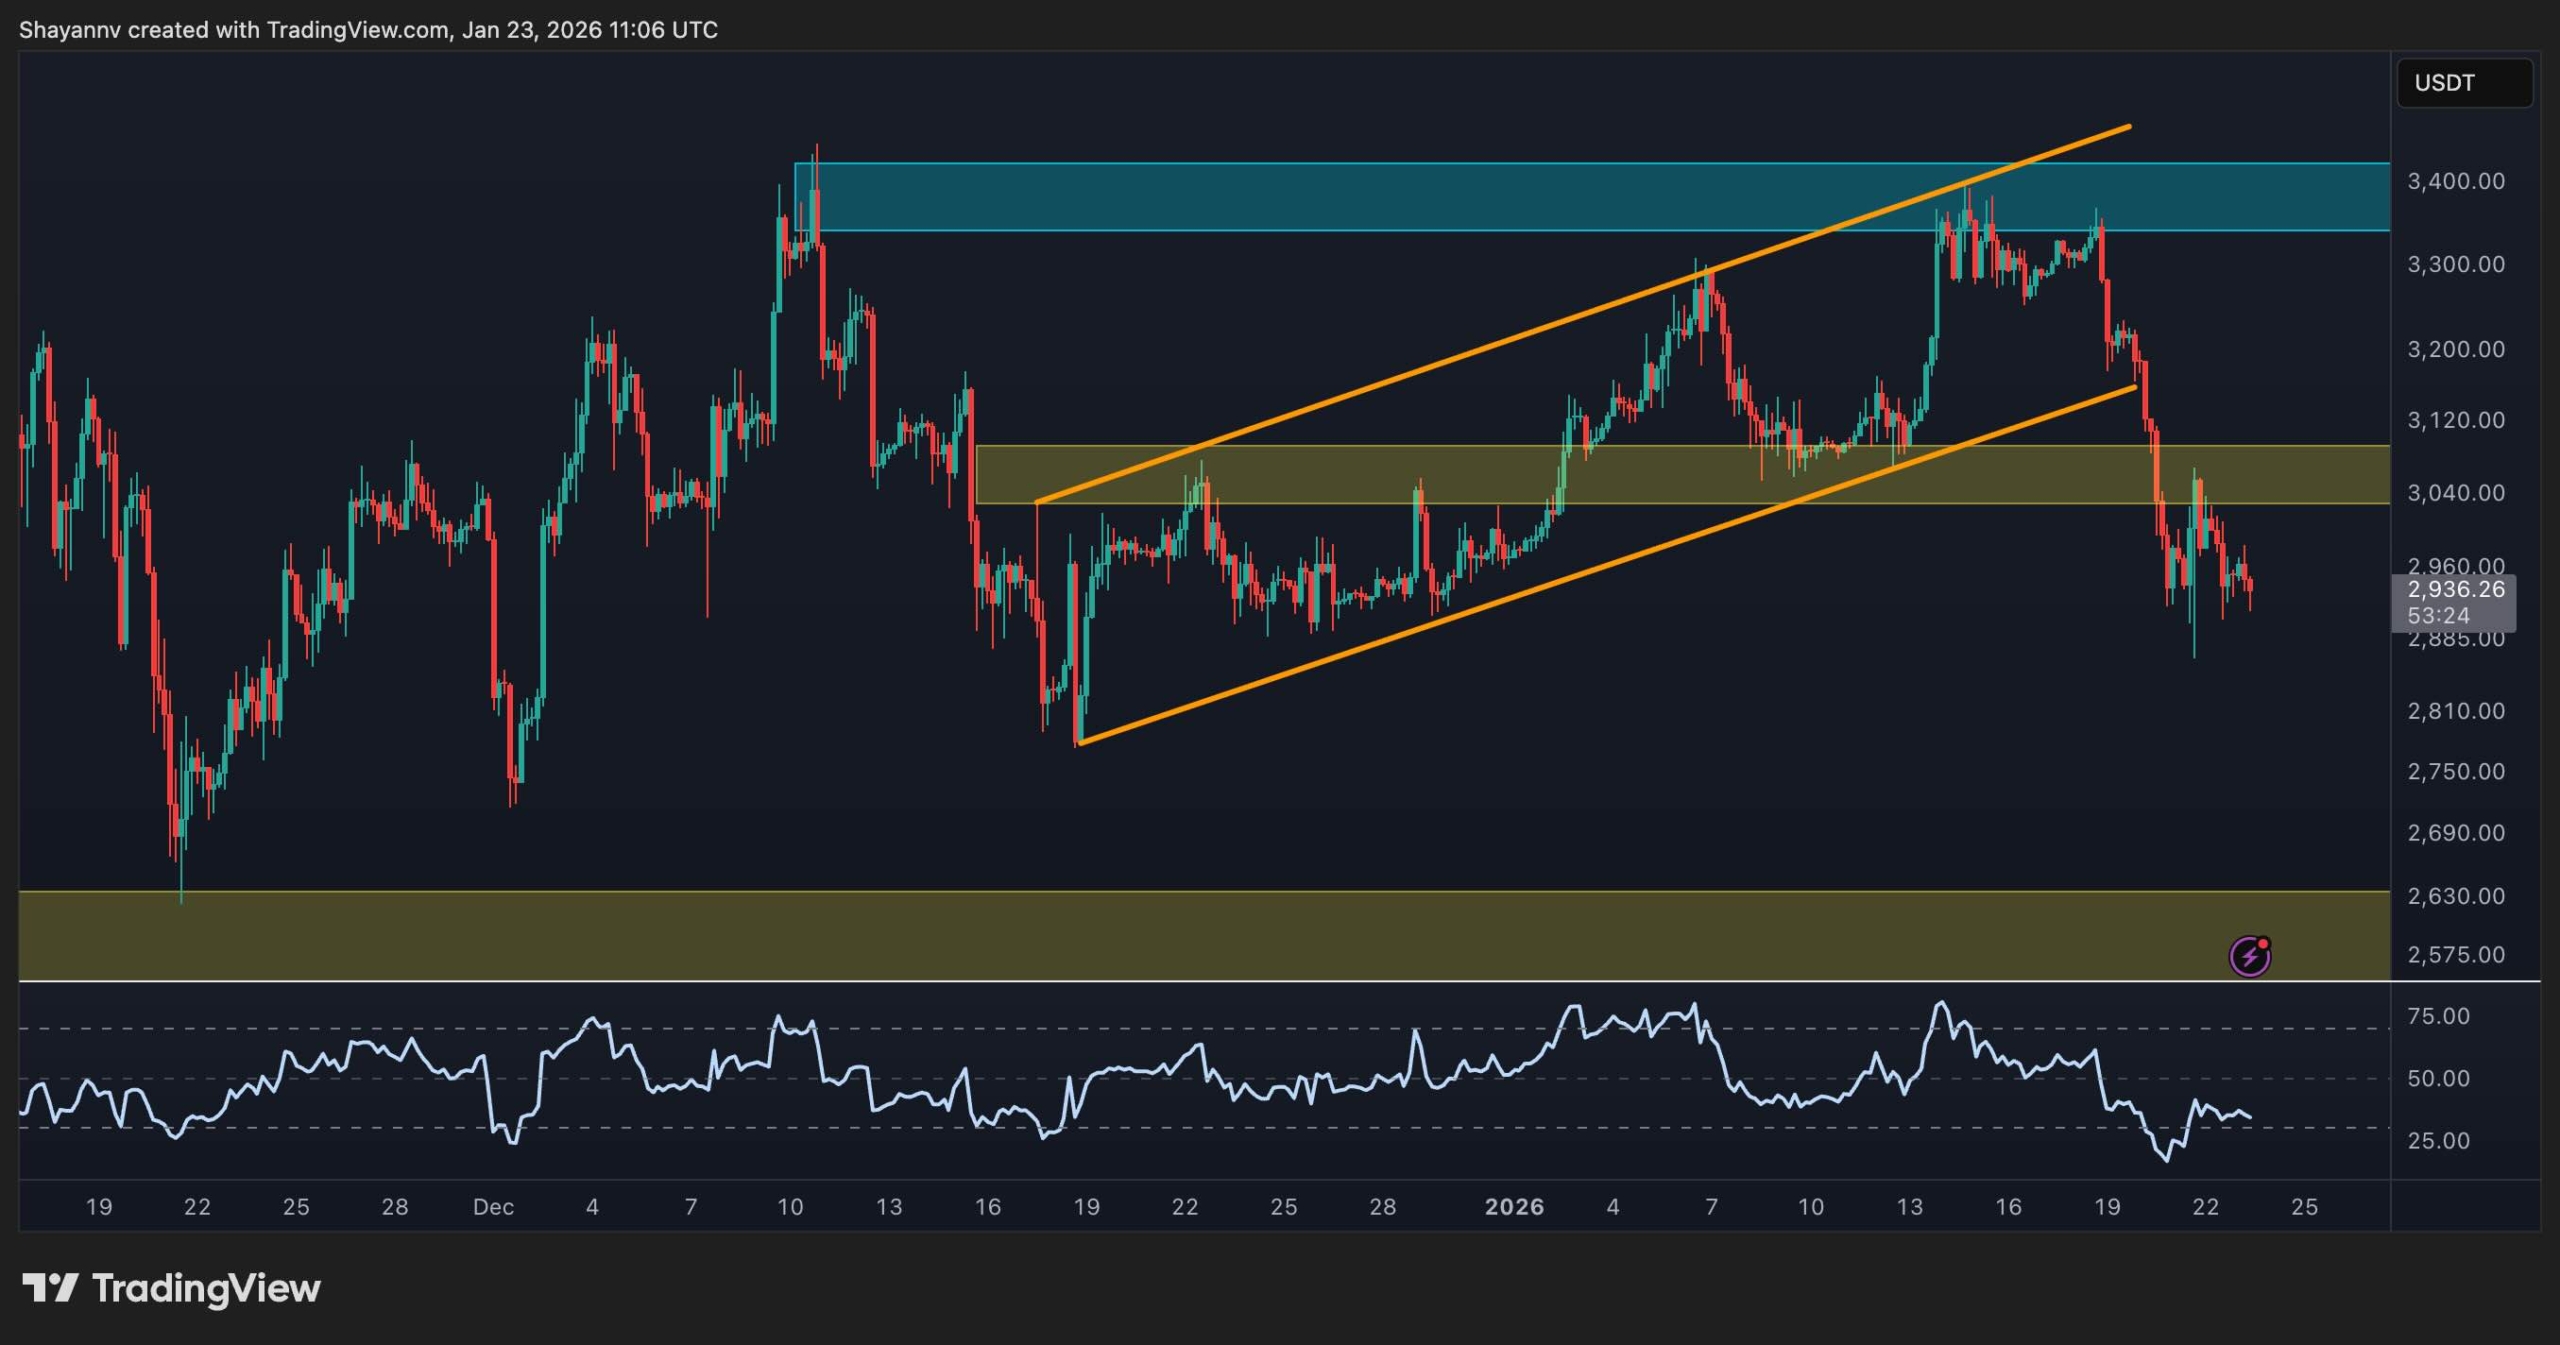
ETH/USDT 4-Hour Chart
The 4-hour chart shows a clear breakdown from the rising channel that carried the price from approximately $2,800 to the recent peak near $3,400. After losing the channel’s lower boundary and the local support around $3,000–$3,100, ETH is now trading in a clear downtrend characterized by lower highs and lower lows, with momentum gauges such as the RSI recovering only modestly from oversold territory.
The immediate tactical pivot sits around the former breakdown zone at $3,000–$3,100. Recovery and consolidation back above this area would suggest a failed breakdown and open a path back toward the $3,400, while continued rejection there would keep pressure on support levels closer to $2,900 and then the higher-timeframe demand at $2,600-$2,700.
Sentiment Analysis
The Coinbase Premium Index for Ethereum has shifted decisively negative over recent weeks, with persistent red readings indicating that spot prices on Coinbase trade at a discount compared to Binance. This configuration signals relatively weaker buy-side interest from U.S. and institutional-leaning participants and often aligns with phases of distribution or cautious positioning in that cohort.
At the same time, historically extended negative premiums can coincide with exhaustion of local selling pressure as weaker hands capitulate to more aggressive offshore demand, setting the stage for a later recovery once macro liquidity or narrative drivers improve. For the moment, however, the sustained discount reinforces the view that the current downswing is driven not only by technical rejection at resistance but also by a conservative bias among U.S. spot flows.

The post Ethereum Price Analysis: Where Can ETH Find a Bottom as $3K Support Cracks? appeared first on CryptoPotato.
Ethereum remains in a corrective, range-bound environment after failing to sustain the early-month advance above the mid-$3,000s. The price action is oscillating between a higher-timeframe demand cluster in the $2,700 region and a broad supply band closer to $3,500, while the main moving averages continue to cap the upside. This structure keeps directional conviction limited Crypto News, ETH Analysis, Ethereum (ETH) Price
This articles is written by : Nermeen Nabil Khear Abdelmalak
All rights reserved to : USAGOLDMIES . www.usagoldmines.com
You can Enjoy surfing our website categories and read more content in many fields you may like .
Why USAGoldMines ?
USAGoldMines is a comprehensive website offering the latest in financial, crypto, and technical news. With specialized sections for each category, it provides readers with up-to-date market insights, investment trends, and technological advancements, making it a valuable resource for investors and enthusiasts in the fast-paced financial world.