Following the aggressive sell-off toward the $1.8K demand region, Ethereum stabilised and produced a corrective rebound. However, this recovery lacks strong momentum and is unfolding within a broader bearish structure. The current price behaviour indicates a potential consolidation between a well-defined demand zone below and an overhead supply area that continues to cap upside attempts.
Ethereum Price Analysis: The Daily Chart
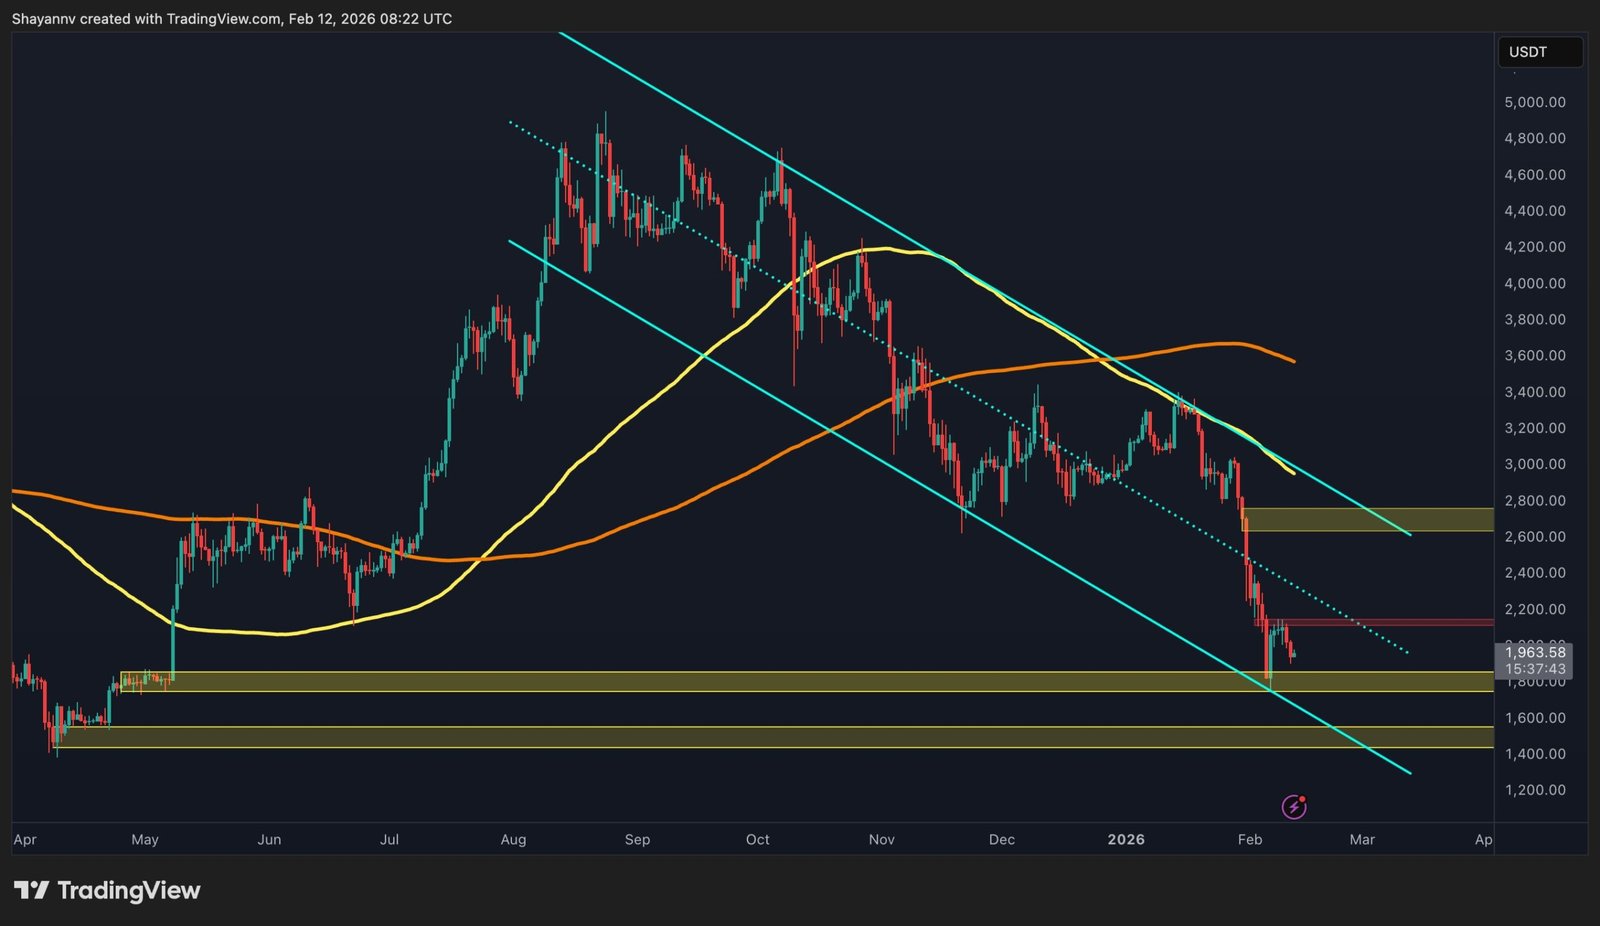
On the daily timeframe, ETH remains within a descending channel, with the price trading below both the 100-day and 200-day moving averages, which are now sloping downward and serving as dynamic resistance. The recent breakdown below the prior major swing low around $2.4K accelerated the sell-off, confirming bearish continuation and triggering a move toward the $1.8K demand zone.
The rebound from this crucial zone shows that buyers are defending this key historical support, which previously acted as an accumulation area. However, the price is currently trading at approximately $2K and remains below the internal resistance near $2.2K.
As long as Ethereum remains between $1.8K and $2.2K, the market is likely to consolidate within this range. A daily close below $1.8K would expose the next lower liquidity pocket toward $1.6K, while a reclaim of $2.2K could open the path toward the $2.6K supply region.
ETH/USDT 4-Hour Chart
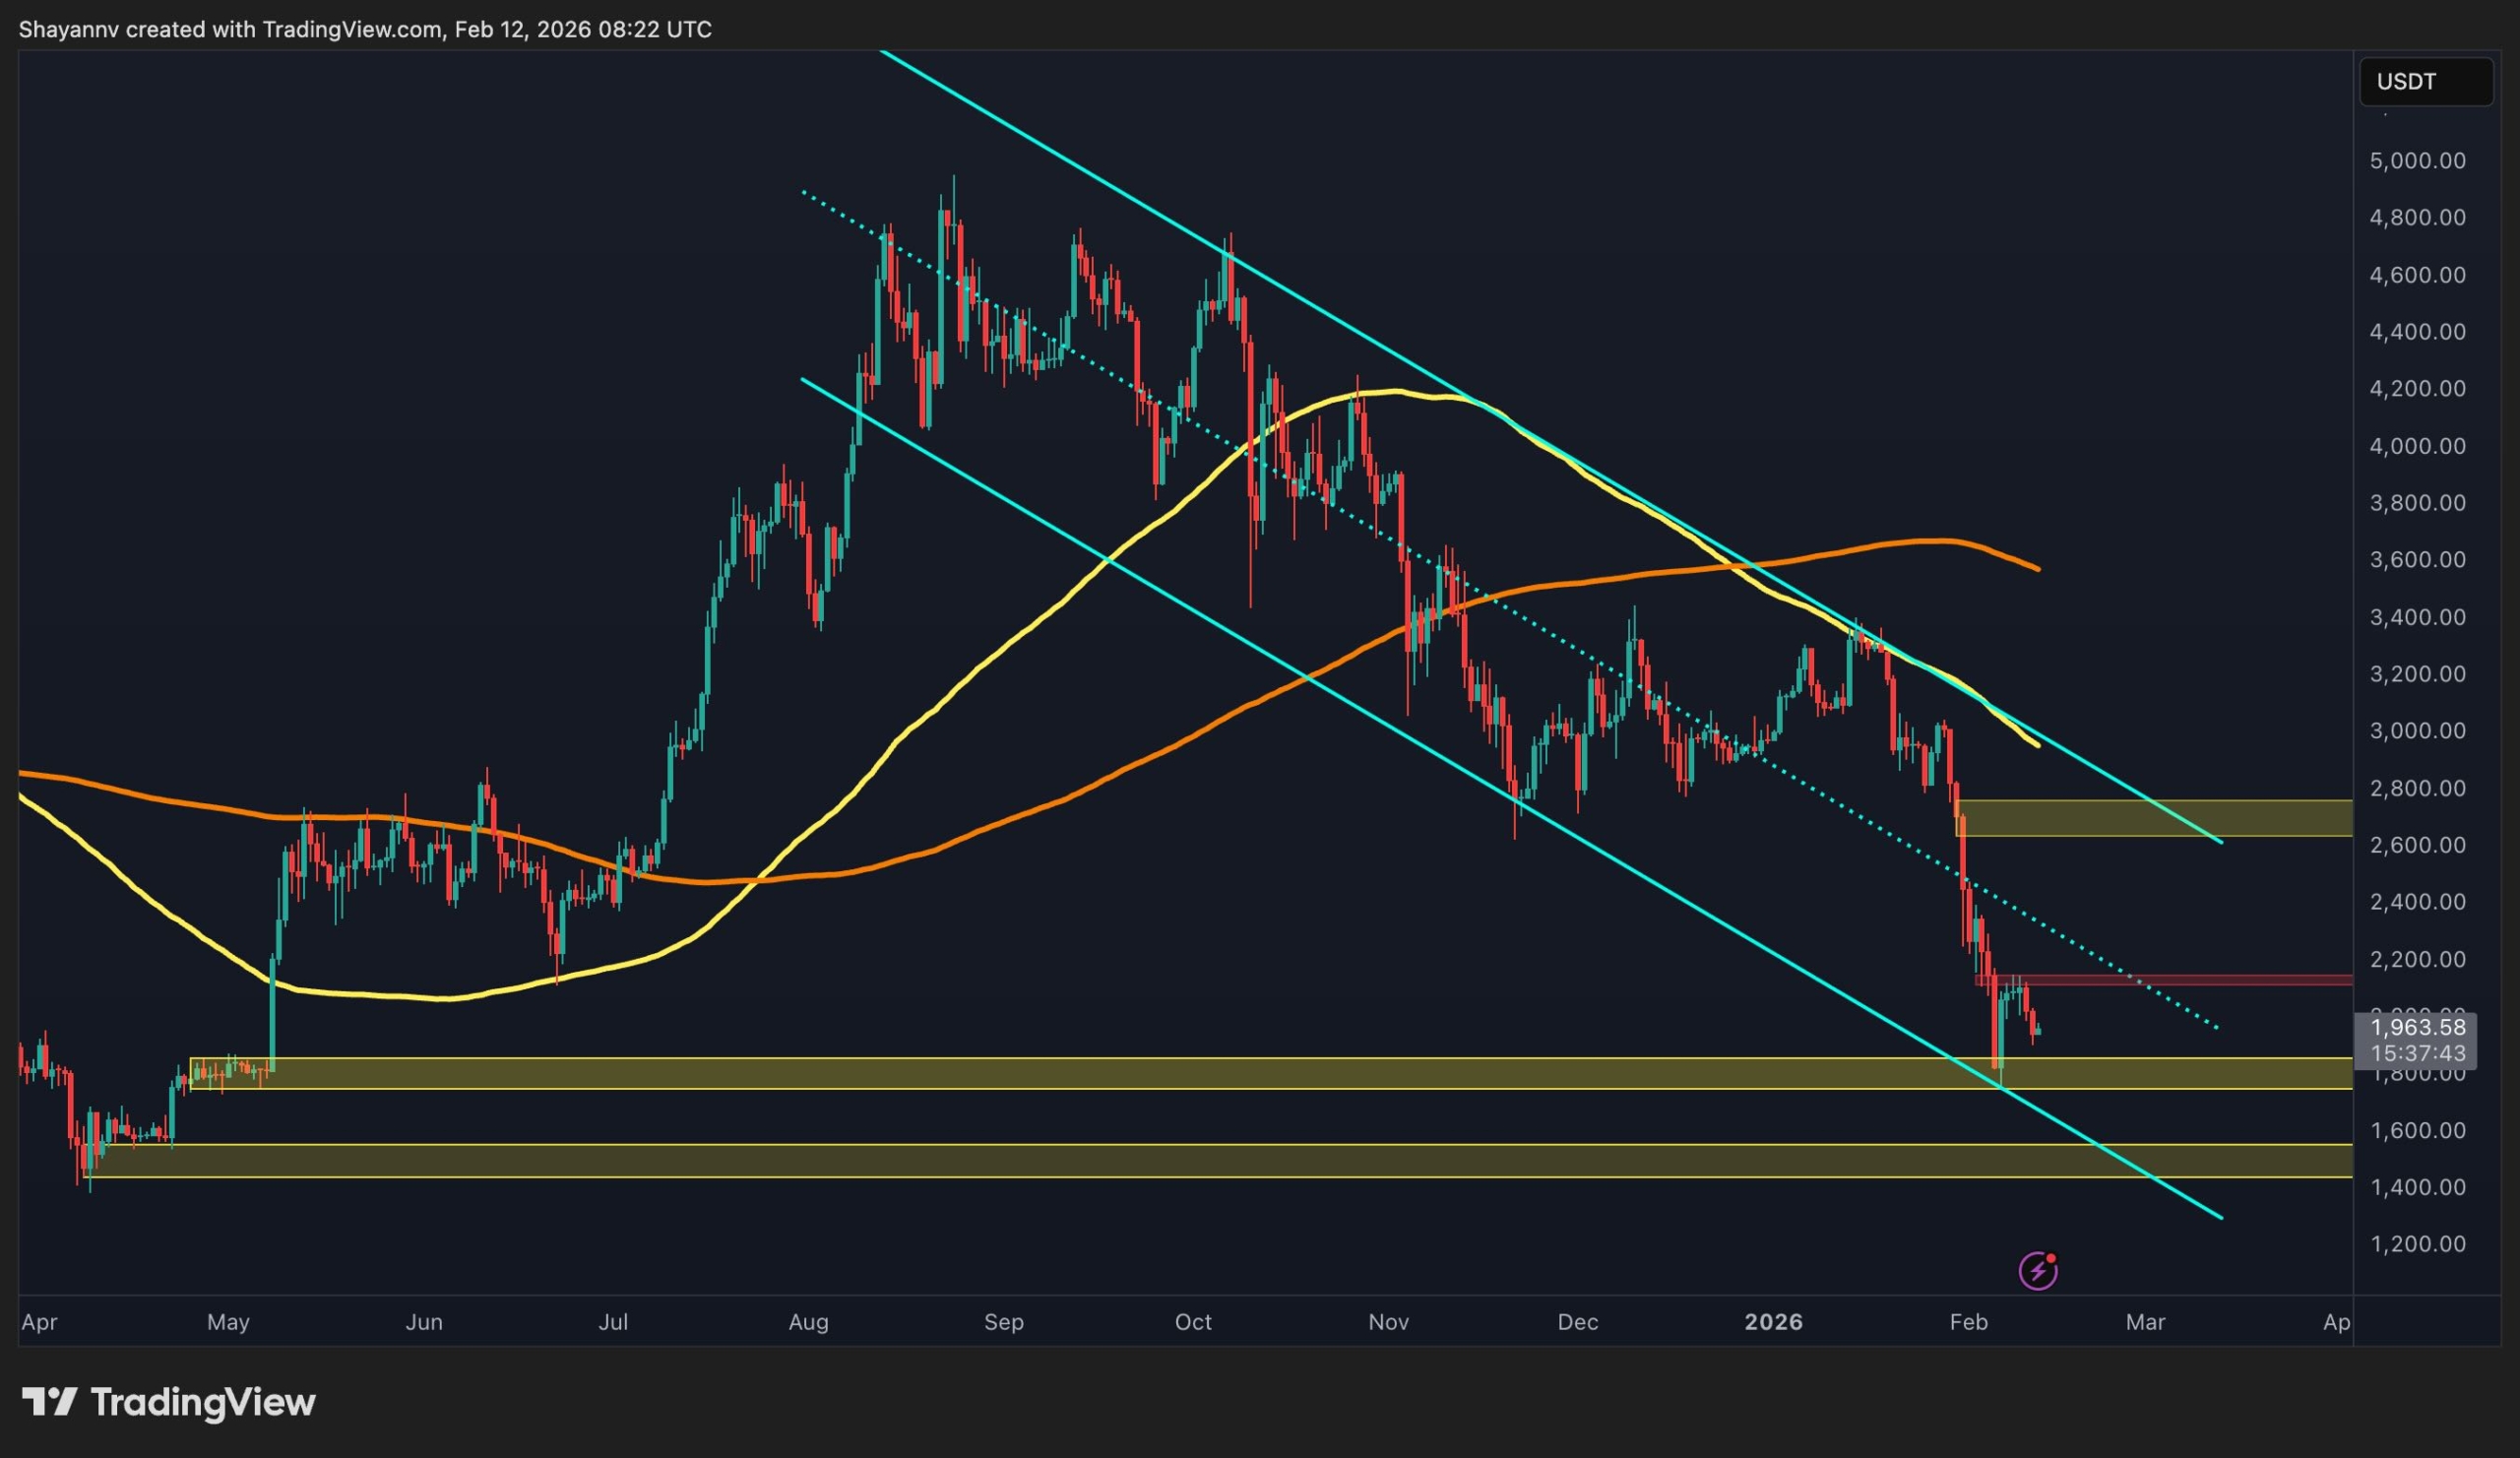
Zooming into the 4-hour timeframe, the price action reveals a compression structure following the sharp decline. Ethereum formed a local bottom near $1.8K and then produced a higher low, creating a short-term ascending trendline against the broader downtrend. At the same time, a descending resistance line from the recent swing high continues to cap price, forming a tightening range.
The immediate supply lies around $2.2K, where the previous breakdown occurred, while the nearest demand remains at $1.8K. With price hovering near $1,960, Ethereum appears to be consolidating between these two zones. A breakout above $2.2K on the 4-hour chart would signal short-term bullish continuation toward $2.4K, whereas a breakdown below $1.8K would likely invalidate the consolidation scenario and resume the dominant bearish trend.
Overall, the structure remains bearish on higher timeframes, but in the short term, Ethereum is compressing between $1.8K demand and $2.8K supply, and the next impulsive move will likely emerge from a decisive break of this range.

Sentiment Analysis
The ETH liquidation heatmap over the last 6 months provides critical confirmation of the bearish technical structure. A significant concentration of liquidity has been built around and just below the $2K level, which has recently acted as a strong magnet for price. The sharp sell-off into this area confirms that downside liquidity was actively targeted, resulting in a large flush of leveraged long positions.
Despite this liquidation event, the heatmap still reveals residual liquidity pockets extending slightly below current price levels, indicating that the market may not have fully exhausted its downside objectives yet. These remaining clusters continue to exert gravitational pull on price, especially if spot demand remains weak and derivatives positioning rebuilds on the long side too quickly.
That said, the intensity of liquidations around the $2K zone suggests that a meaningful portion of forced selling has already occurred. This reduces immediate liquidation pressure and explains the short-term stabilization seen after the drop. However, from an on-chain perspective, this behavior supports consolidation or corrective rebounds, not a confirmed trend reversal, unless liquidity interest decisively shifts back above current levels.
In summary, on-chain data aligns closely with the technical picture: Ethereum is still operating in a bearish liquidity-driven environment, with downside risks remaining active as long as price fails to reclaim key supply zones and attract sustained spot demand.

The post Ethereum Price Prediction: Is the Bottom In for ETH? $1.8K Support Holds Key to Recovery appeared first on CryptoPotato.
Following the aggressive sell-off toward the $1.8K demand region, Ethereum stabilised and produced a corrective rebound. However, this recovery lacks strong momentum and is unfolding within a broader bearish structure. The current price behaviour indicates a potential consolidation between a well-defined demand zone below and an overhead supply area that continues to cap upside attempts. Crypto News, ETH Analysis, Ethereum (ETH) Price
This articles is written by : Nermeen Nabil Khear Abdelmalak
All rights reserved to : USAGOLDMIES . www.usagoldmines.com
You can Enjoy surfing our website categories and read more content in many fields you may like .
Why USAGoldMines ?
USAGoldMines is a comprehensive website offering the latest in financial, crypto, and technical news. With specialized sections for each category, it provides readers with up-to-date market insights, investment trends, and technological advancements, making it a valuable resource for investors and enthusiasts in the fast-paced financial world.