Ethereum remains under heavy bearish pressure, with recent price action confirming a continuation of the broader downtrend. The market is currently reacting to a major sell-side expansion, and both technical structure and on-chain liquidity dynamics suggest that the asset is still navigating a critical phase where downside targets remain relevant, even if short-term relief bounces occur.
Ethereum Price Analysis: The Daily Chart
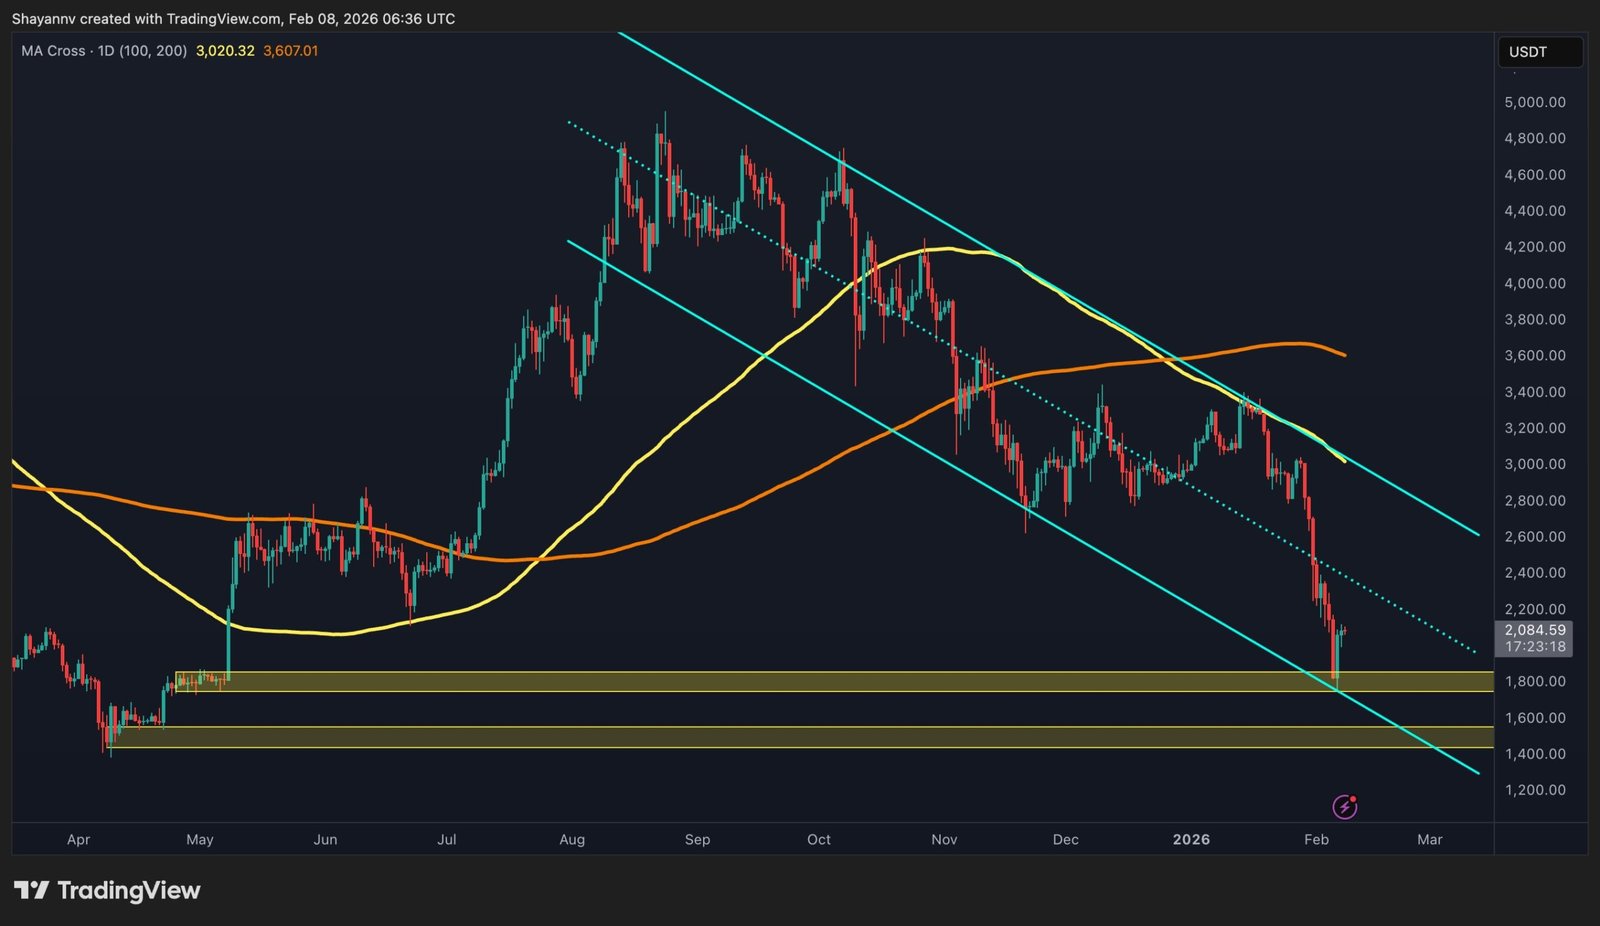
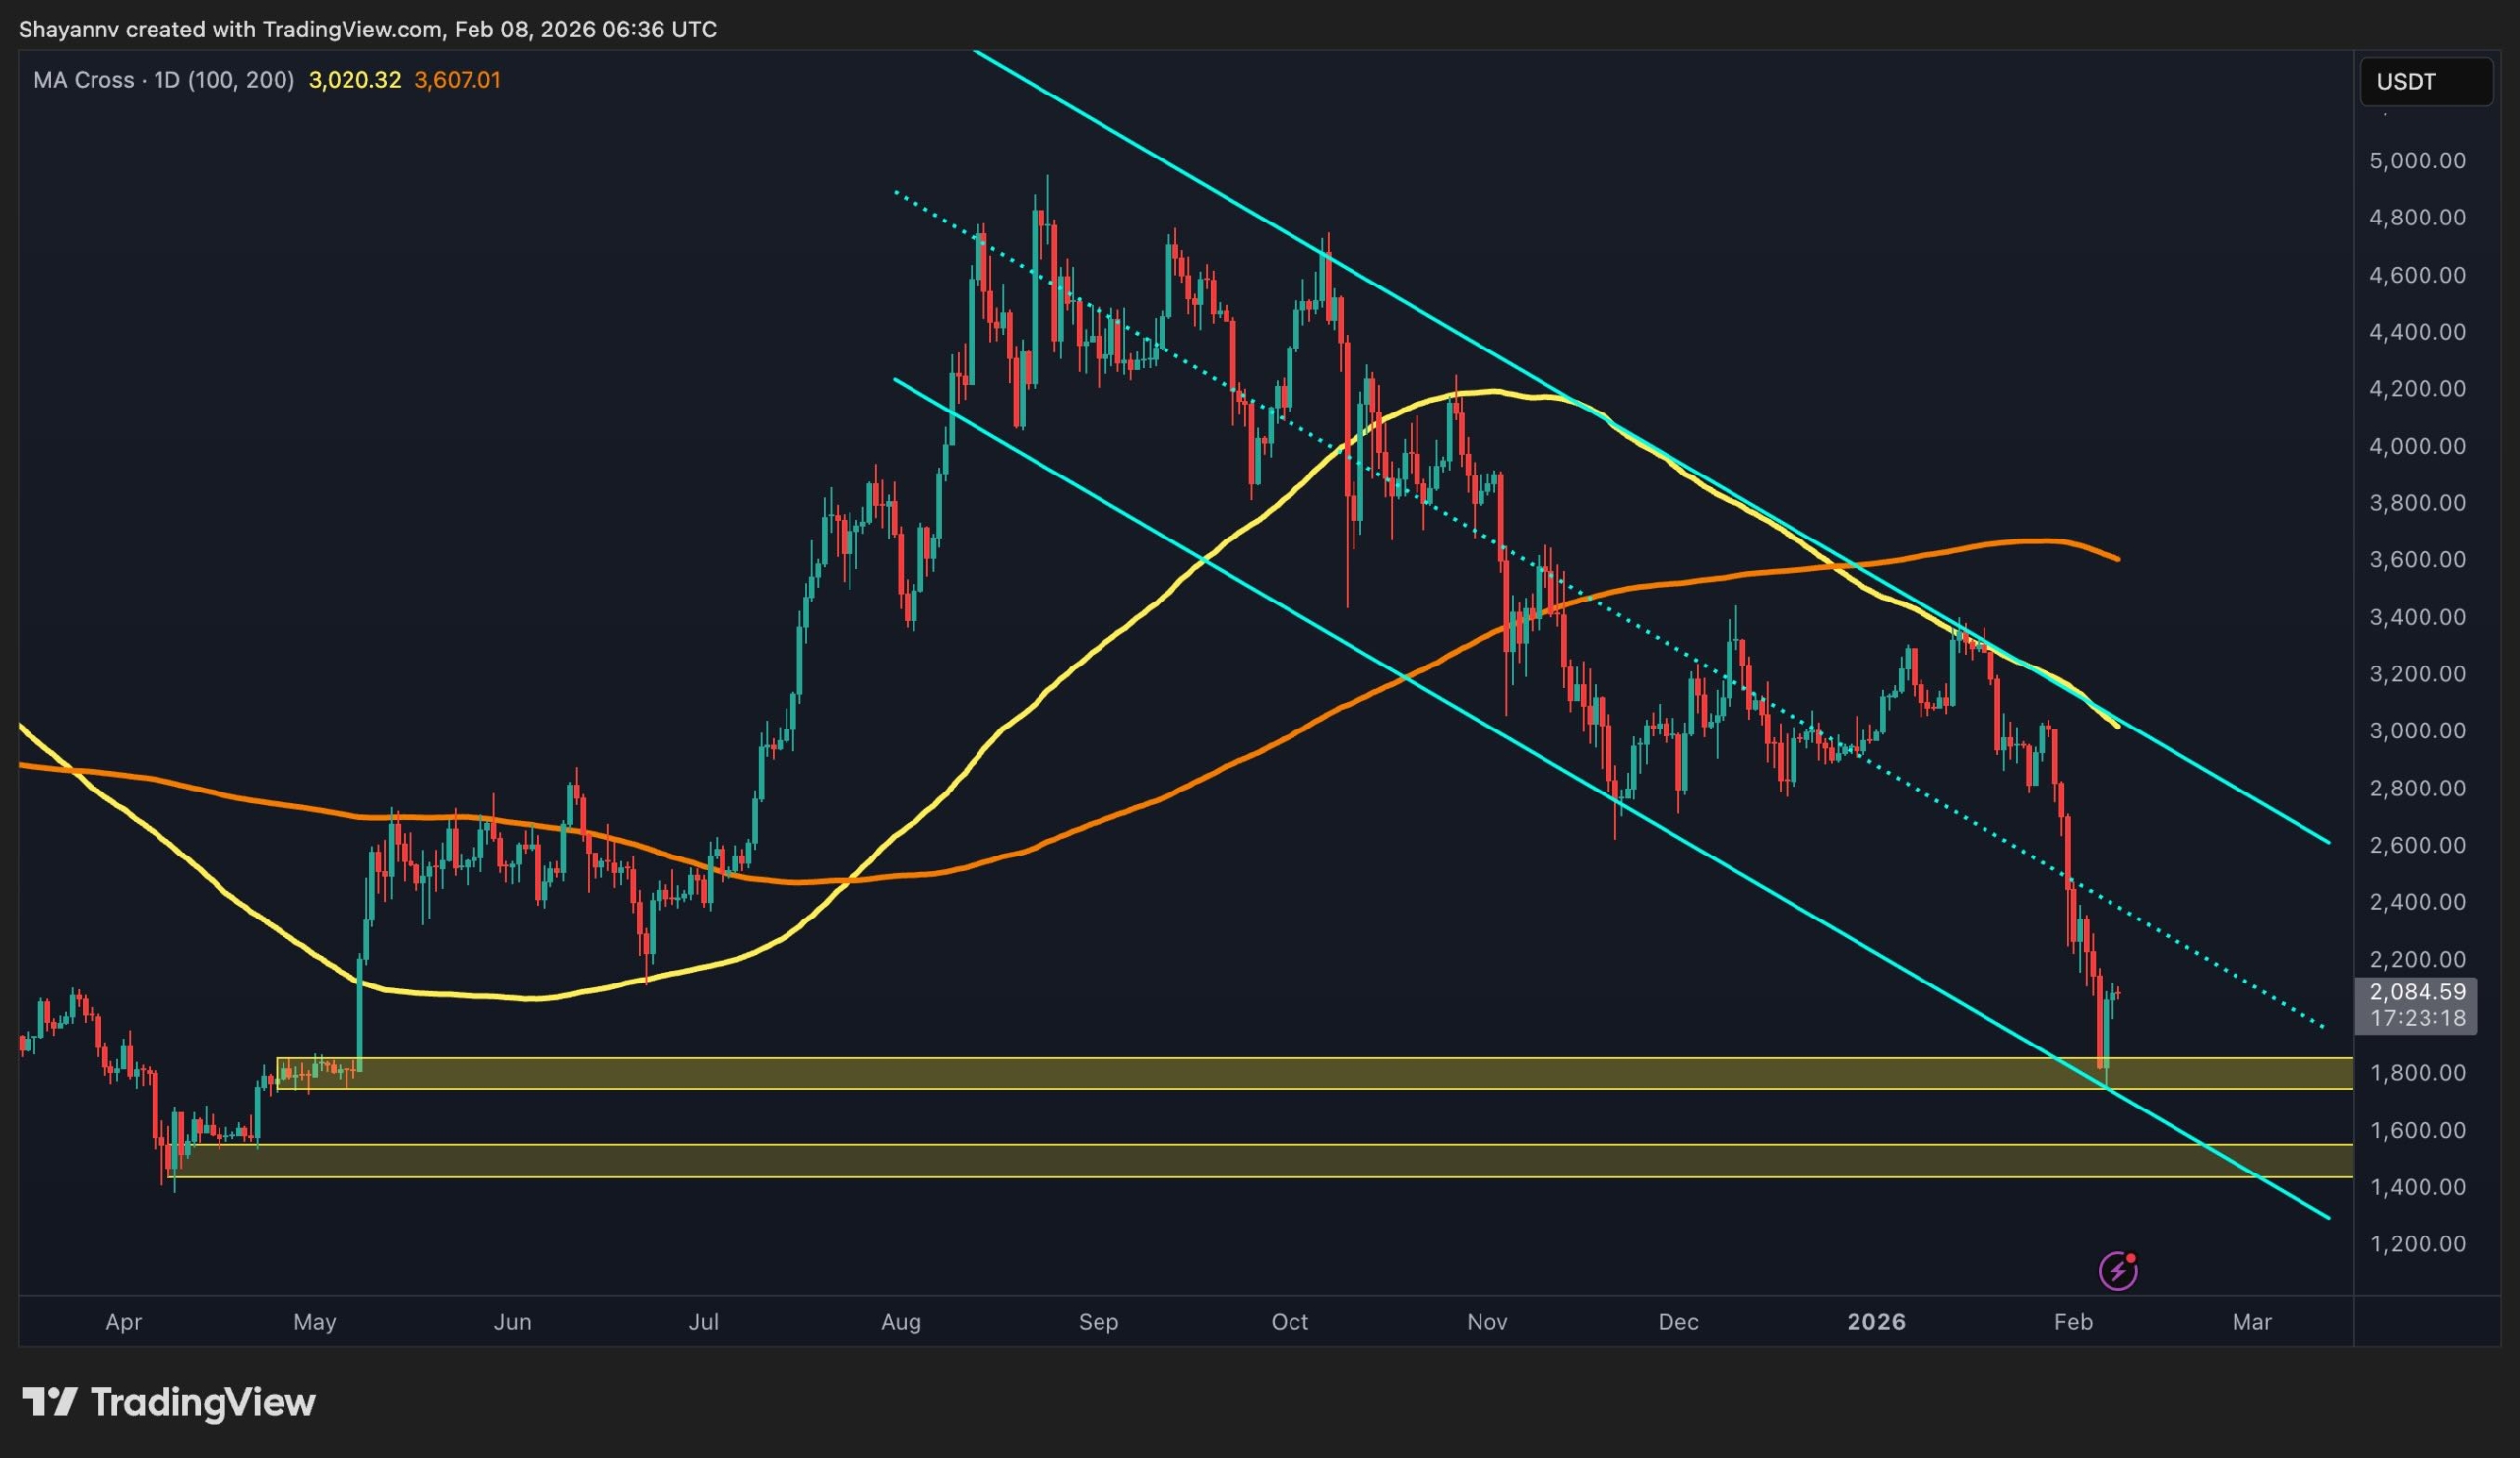
On the daily timeframe, ETH is clearly trading within a well-defined descending channel, with the price recently accelerating toward the lower boundary of this structure. The most important observation on the chart is the clean breakdown below multiple prior support levels, followed by a sharp impulsive leg to the downside. This move confirms strong bearish acceptance rather than a simple liquidity sweep.
The asset has now reached a major higher-timeframe demand zone, located around the $1.8K region, which previously acted as a base during earlier accumulation phases. The reaction off this zone has produced a modest bounce, but so far this move lacks structural strength and remains corrective in nature.
Nevertheless, the market is likely to enter a consolidation-correction phase above this crucial support until a decisive breakout occurs. The main supply zone during this consolidation range is the channel’s middle line, located at the $2.3K threshold. A break above this resistance will open the door for an extended bullish retracement toward the $2.5K significant resistance.
ETH/USDT 4-Hour Chart
Zooming into the 4-hour timeframe, the bearish structure becomes even clearer. The most recent price action shows a sharp sell-off into demand, followed by a shallow bounce that lacks impulsive follow-through.
Crucially, the rebound appears corrective and technically opens the door for a pullback toward the most recent supply zones and Fibonacci levels, located around the $2.3K to $2.6K region. These areas align with prior breakdown levels and correspond to zones where sellers previously intervened aggressively. If the price retraces into these levels without strong volume or momentum, they are likely to act as rejection zones rather than breakout points.
Until Ethereum can reclaim and hold above these supply areas, the 4-hour structure continues to favour continuation to the downside or extended consolidation within the lower range, rather than a trend reversal.

Sentiment Analysis
The ETH liquidation heatmap over the last 6 months provides critical confirmation of the bearish technical structure. A significant concentration of liquidity has been built around and just below the $2K level, which has recently acted as a strong magnet for price. The sharp sell-off into this area confirms that downside liquidity was actively targeted, resulting in a large flush of leveraged long positions.
Despite this liquidation event, the heatmap still reveals residual liquidity pockets extending slightly below current price levels, indicating that the market may not have fully exhausted its downside objectives yet. These remaining clusters continue to exert gravitational pull on price, especially if spot demand remains weak and derivatives positioning rebuilds on the long side too quickly.
That said, the intensity of liquidations around the $2K zone suggests that a meaningful portion of forced selling has already occurred. This reduces immediate liquidation pressure and explains the short-term stabilization seen after the drop. However, from an on-chain perspective, this behavior supports consolidation or corrective rebounds, not a confirmed trend reversal, unless liquidity interest decisively shifts back above current levels.
In summary, on-chain data aligns closely with the technical picture: Ethereum is still operating in a bearish liquidity-driven environment, with downside risks remaining active as long as price fails to reclaim key supply zones and attract sustained spot demand.

The post Is $1.8K the Bottom? ETH Hits Critical Demand Zone (Ethereum Price Analysis) appeared first on CryptoPotato.
Ethereum remains under heavy bearish pressure, with recent price action confirming a continuation of the broader downtrend. The market is currently reacting to a major sell-side expansion, and both technical structure and on-chain liquidity dynamics suggest that the asset is still navigating a critical phase where downside targets remain relevant, even if short-term relief bounces Crypto News, ETH Analysis, Ethereum (ETH) Price
This articles is written by : Nermeen Nabil Khear Abdelmalak
All rights reserved to : USAGOLDMIES . www.usagoldmines.com
You can Enjoy surfing our website categories and read more content in many fields you may like .
Why USAGoldMines ?
USAGoldMines is a comprehensive website offering the latest in financial, crypto, and technical news. With specialized sections for each category, it provides readers with up-to-date market insights, investment trends, and technological advancements, making it a valuable resource for investors and enthusiasts in the fast-paced financial world.