
Ripple’s XRP has shown a notable improvement in short-term structure, with buyers stepping in aggressively after an extended corrective phase. Recent price action suggests a shift from passive consolidation into active recovery, although key overhead resistance levels remain in play.
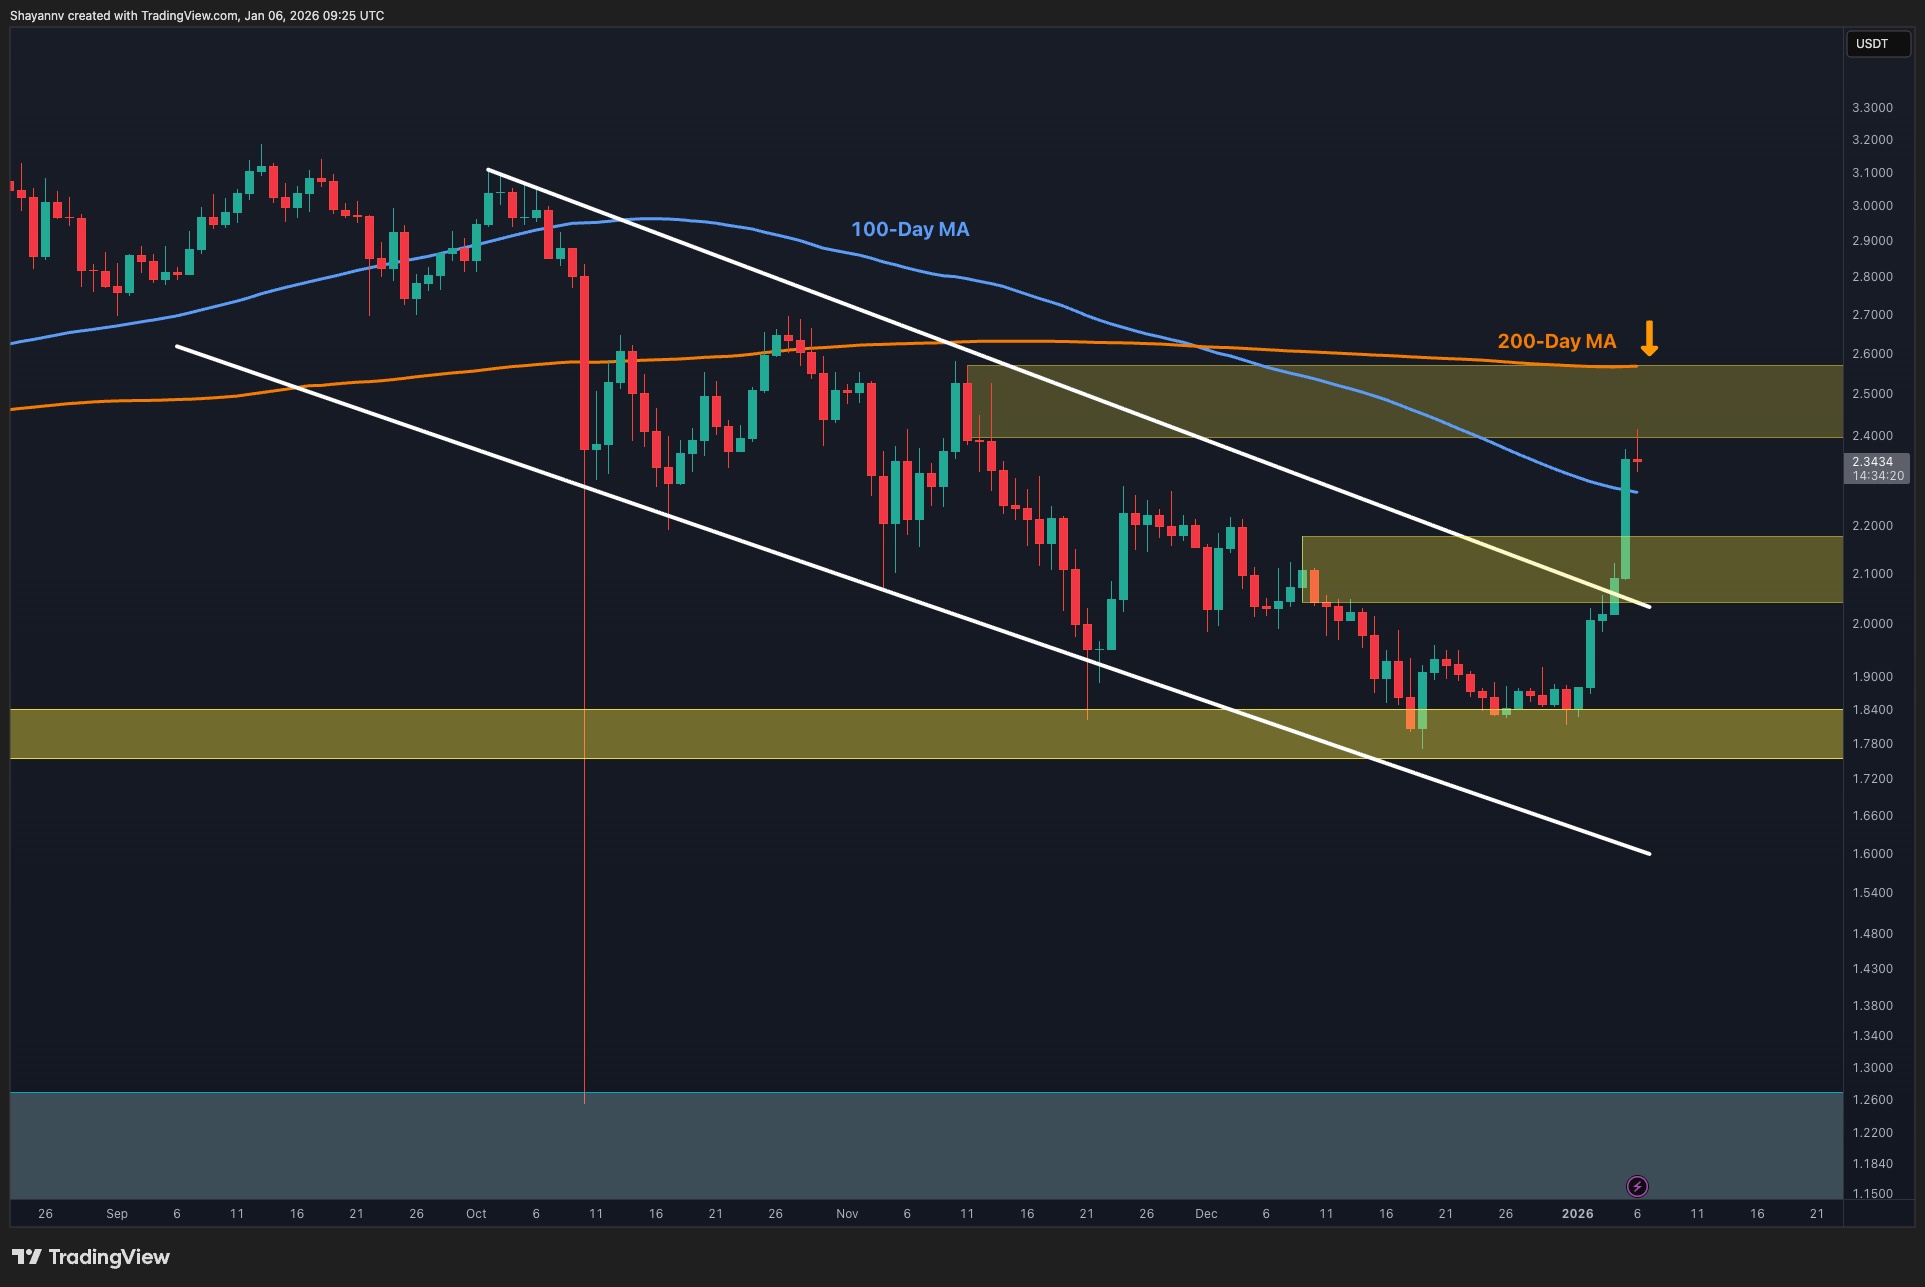
Ripple Price Analysis: The Daily Chart
On the daily timeframe, XRP has reacted strongly from the established buyer’s base around the lower demand zone near $1.8. This area has repeatedly absorbed selling pressure, confirming it as a meaningful demand zone where buyers are willing to defend the price. The latest daily candles show a clear bullish breakout from the descending structure, indicating that sellers are losing control after months of lower highs.
Despite this positive development, the asset is now approaching a critical resistance zone around $2.4–$2.5. This area aligns closely with the 200-day moving average, making it a technically significant barrier. While the breakout is constructive, follow-through strength will be required for the token to establish acceptance above this region. A rejection here would not invalidate the recovery, but it would likely keep the price trading within a broader range rather than transitioning into a sustained bullish trend.
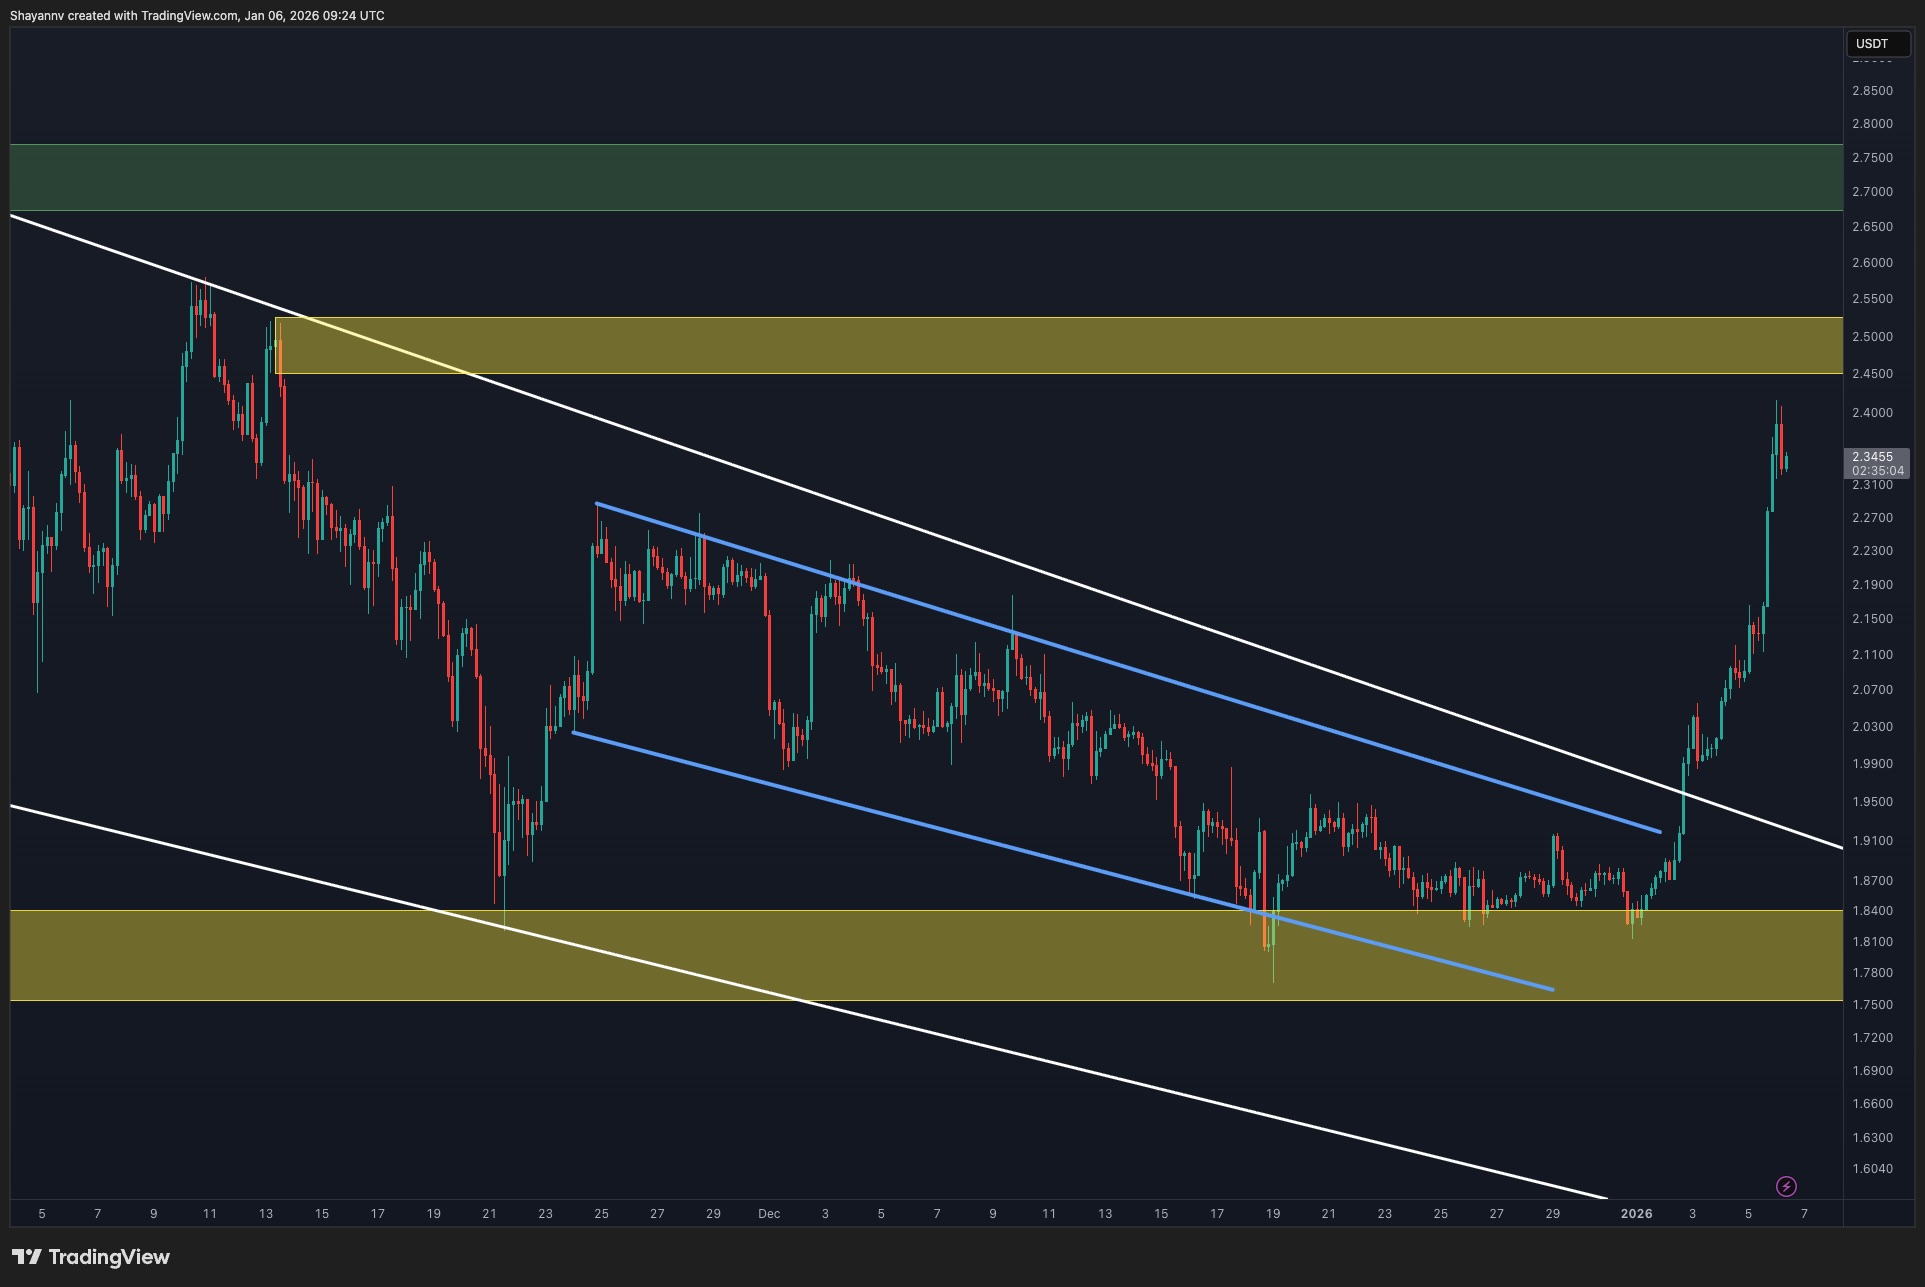
XRP/USDT 4-Hour Chart
The 4-hour chart provides a clearer view of the recent shift in momentum. XRP spent a prolonged period consolidating above the buyer’s base, forming a compression structure as selling pressure weakened. The subsequent breakout to the upside was decisive, with the price reclaiming the descending channel and pushing higher without immediately retracing back into the prior range.
This breakout reflects improving short-term sentiment, as higher lows are now forming above the former consolidation zone. However, similar to the daily timeframe, the price is now running into a resistance cluster near $2.1–$2.2, which corresponds with prior supply and the path of the declining moving average. A successful hold above the breakout level would keep the bullish structure intact, while a failure to sustain above this zone could result in a pullback toward the buyer’s base for a retest.
The post Ripple Price Analysis: What Is XRP’s Next Most Likely Scenario After 30% Weekly Surge? appeared first on CryptoPotato.
Ripple’s XRP has shown a notable improvement in short-term structure, with buyers stepping in aggressively after an extended corrective phase. Recent price action suggests a shift from passive consolidation into active recovery, although key overhead resistance levels remain in play. Ripple Price Analysis: The Daily Chart On the daily timeframe, XRP has reacted strongly from Crypto News, XRP Analysis, XRPBTC, XRPUSD, Ripple (XRP) Price
This articles is written by : Nermeen Nabil Khear Abdelmalak
All rights reserved to : USAGOLDMIES . www.usagoldmines.com
You can Enjoy surfing our website categories and read more content in many fields you may like .
Why USAGoldMines ?
USAGoldMines is a comprehensive website offering the latest in financial, crypto, and technical news. With specialized sections for each category, it provides readers with up-to-date market insights, investment trends, and technological advancements, making it a valuable resource for investors and enthusiasts in the fast-paced financial world.