
Ripple’s XRP is still trading inside a sustained downward structure, with each recovery attempt meeting supply. The latest rejection near the $2.45–$2.55 resistance keeps the broader bearish leg valid, while the higher-timeframe demand at $2.05–$2.15 remains the key zone separating a controlled correction from a deeper sell-off.
XRP Price Analysis
By Shayan
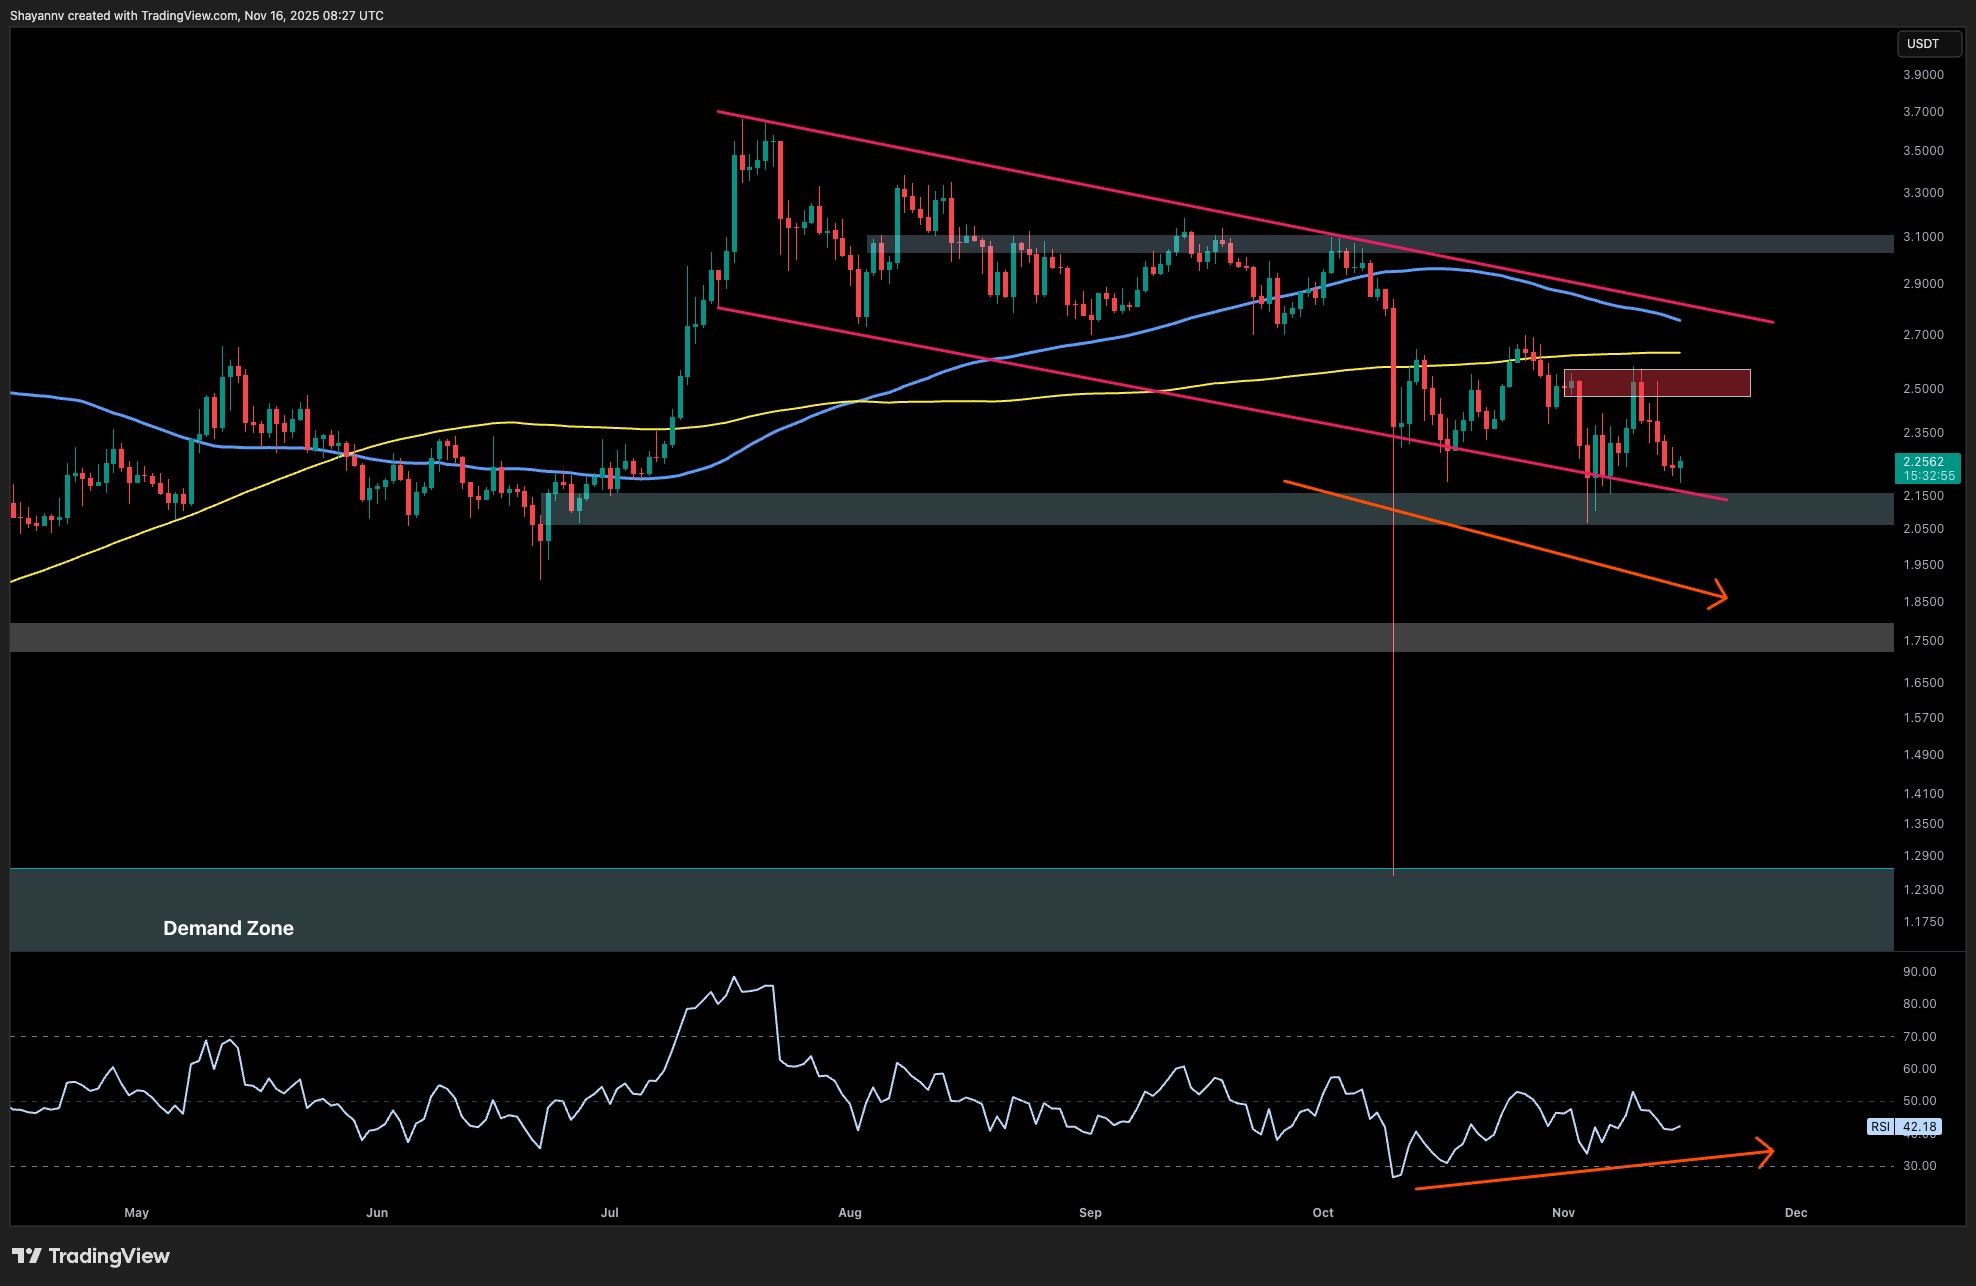
The Daily Chart
On the daily timeframe, Ripple’s token continues to trade within a large descending channel formation, a structure that often precedes bullish reversals when supported by volume expansion. After rebounding from the $2.1–$2.2 demand zone, the price has reclaimed ground toward $2.5, aligning with a crucial supply zone (order Block) and close to the 200-day moving average, while the 100-day MA remains slightly overhead near $2.7.
This confluence represents a critical resistance cluster, combining dynamic resistance (MAs), a prior supply block, and the wedge’s structural ceiling. A daily close above $2.6 would mark a potential breakout confirmation, shifting market structure in favor of buyers and paving the way toward the $2.8–$3.1 macro supply range.
However, failure to break this level could lead to another rejection, keeping XRP inside its mid-term descending pattern and possibly triggering a retest of the $2.3–$2.2 support zone. RSI has broken above the midline, signaling recovering momentum, yet sustained strength will depend on confirmation from price action and volume expansion through resistance.
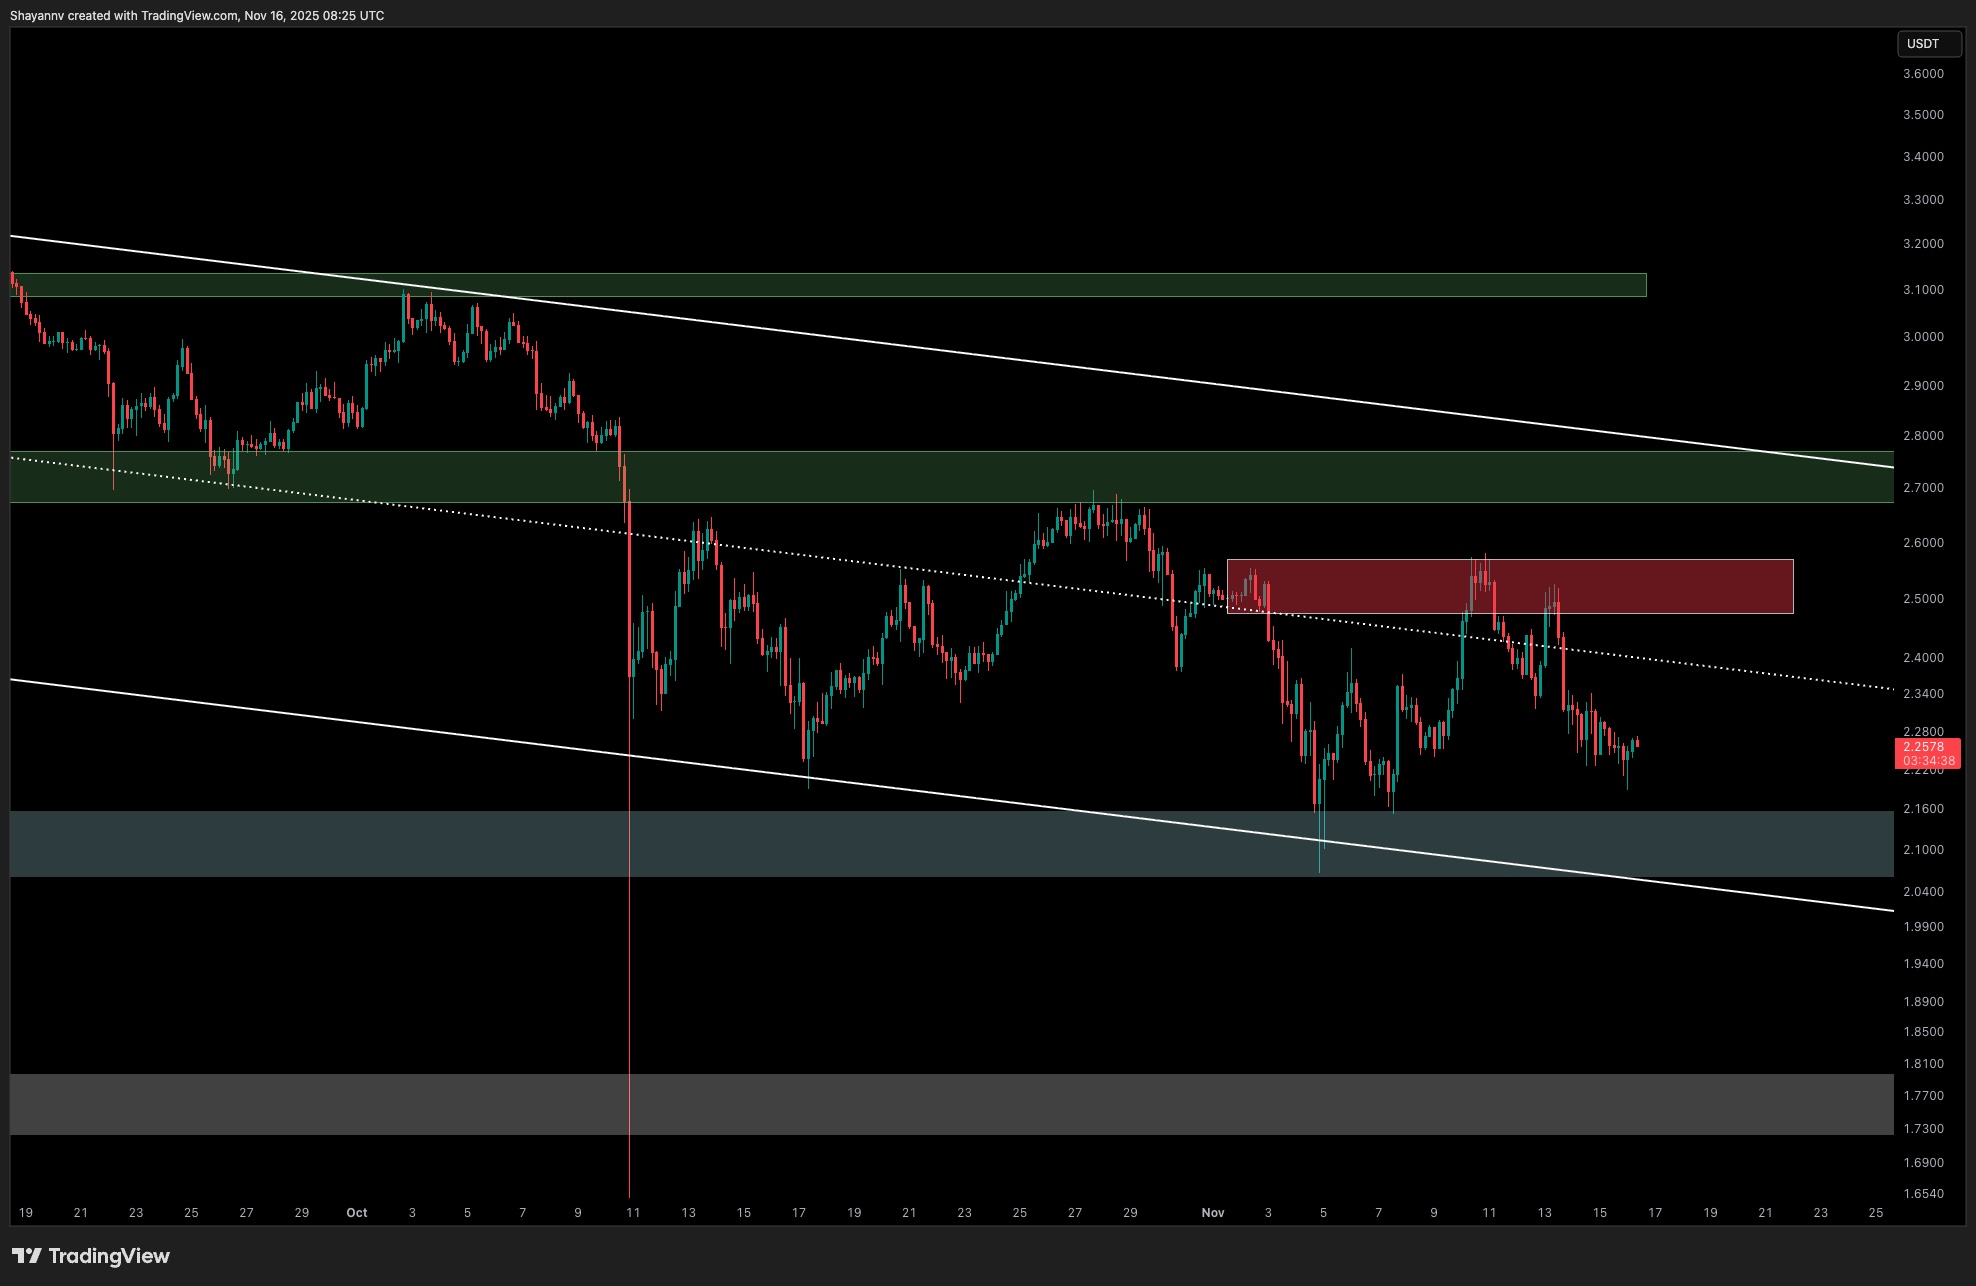
The 4-Hour Chart
On the 4-hour chart, XRP continues to track within a clean descending channel, with well-defined lower highs and lower lows shaping its short-term market structure. The most recent rally into the $2.45–$2.55 rejection zone aligned perfectly with the channel’s midline, confirming its role as an active seller’s base.
Following the rejection, the price slid back toward the $2.20–$2.25 region, where a soft reaction occurred, though momentum remains weak. The dotted internal trendline from the earlier breakdown continues to serve as intraday resistance, preventing bullish continuation attempts.
The broader characteristic of this chart is compression. The price is drifting lower within the channel, but volatility is contracting, indicating that sellers are losing strength while buyers are selectively accumulating at the bottom boundary.
This type of price action often precedes a larger expansion move, but the direction will depend entirely on whether XRP breaks above the descending trendline (bullish) or falls below the $2.15 support (bearish).
A sweep into the lower boundary near $2.05 followed by a sharp reversal would fit the textbook model of a final liquidity grab before a corrective bounce. Conversely, losing this level would likely accelerate the downtrend into the deeper $1.75 liquidity pocket.
The post XRP Risks Another Drop Below $2 if This Support Fails: Ripple Price Analysis appeared first on CryptoPotato.
Ripple’s XRP is still trading inside a sustained downward structure, with each recovery attempt meeting supply. The latest rejection near the $2.45–$2.55 resistance keeps the broader bearish leg valid, while the higher-timeframe demand at $2.05–$2.15 remains the key zone separating a controlled correction from a deeper sell-off. XRP Price Analysis By Shayan The Daily Chart Crypto News, XRP Analysis, XRPBTC, XRPUSD, Ripple (XRP) Price
This articles is written by : Nermeen Nabil Khear Abdelmalak
All rights reserved to : USAGOLDMIES . www.usagoldmines.com
You can Enjoy surfing our website categories and read more content in many fields you may like .
Why USAGoldMines ?
USAGoldMines is a comprehensive website offering the latest in financial, crypto, and technical news. With specialized sections for each category, it provides readers with up-to-date market insights, investment trends, and technological advancements, making it a valuable resource for investors and enthusiasts in the fast-paced financial world.