TLDR:
- Litecoin bounced from $83 but now struggles to hold above its 20-SMA near $85.
- $87 is acting as resistance and may define the direction of the next move.
- Liquidity zones at $94 and $81 suggest volatility could return quickly.
- Volume profile shows strong interest at current levels from both buyers and sellers.
Litecoin (LTC) is approaching a decisive point after recovering from early June lows. The asset bounced from the $83 zone, briefly reclaiming $94, before retracing under $86.
Analysts are watching the current price range closely as it aligns with critical support and resistance levels. With liquidity clusters forming above and below the current level, price volatility could increase.
Traders remain cautious, eyeing both upside and downside scenarios in the days ahead.
Litecoin Eyes Recovery After Testing Support
According to crypto analyst Zen (@WiseAnalyze), Litecoin rebounded from the $83.48 zone earlier this month, moving in line with a prior forecast.
The bounce coincided with the monthly 20-day simple moving average (SMA), estimated around $85.20, helping drive a short-term rally to a local peak of $94.16.
This resistance zone, noted as a prior liquidity area, acted as a ceiling before LTC pulled back. As of June 20, the price sits around $85.82, suggesting the market is testing the SMA as potential support again.
Last forecast posted on your request worked out fine
$LTC bounced from ~83 zone and bounced to 94
May close at 87 and so far Litecoin price is under that SR level.
Monthly 20-sma at 85.2 and now price is trying to bounce from it.Major liquidity pools are above same… https://t.co/J8WBZGCL96 pic.twitter.com/mcvovF4qbp
— Zen (@WiseAnalyze) June 20, 2025

Zen noted that the $87 level is now acting as a resistance zone. This area also aligns with Litecoin’s monthly close level, making it a key point for future price moves. The current tight consolidation around the SMA shows market indecision, with no clear breakout or breakdown.
If bulls reclaim the $87 level with strength, price could revisit the $93 to $95 range, retesting earlier highs and tapping into the upper liquidity pool.
Breakdown Could Push LTC Toward Lower Liquidity Zones
If the $85 support fails, downside pressure may increase. A drop below the 20-SMA could drive Litecoin back toward the $81 mark, where another liquidity zone waits. Below that, historical levels near $77 and $72.89 offer additional support.
Analysts emphasize that both $94.16 and $81 are areas where stop orders or large market interest may trigger sharp moves, depending on which side gets tested first.
The volume profile included in Zen’s analysis shows that most trading activity is clustered near current price levels. This supports the idea of a high-interest range where buyers and sellers are actively participating.
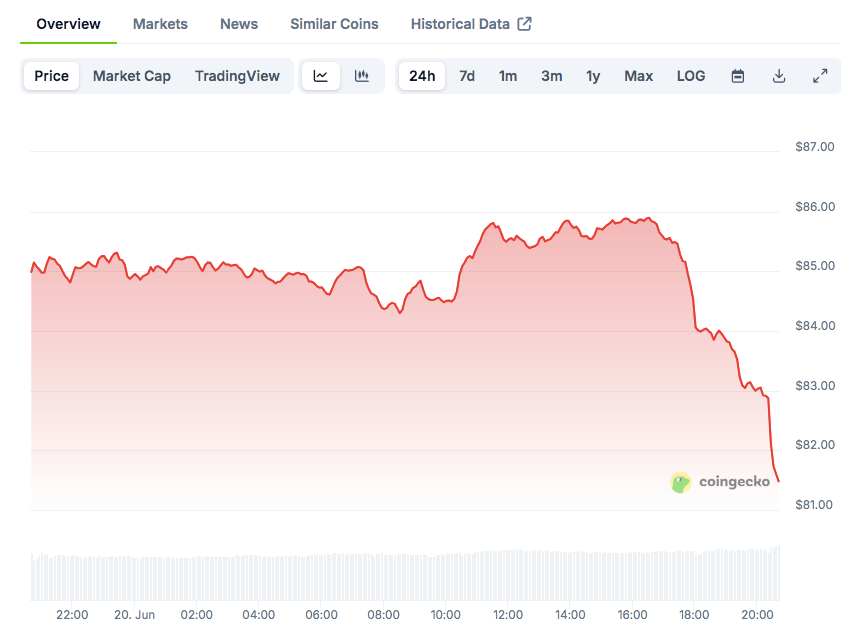
Data from CoinGecko places LTC at $81.82 at publication, marking a 3.28% dip in the last 24 hours and a 3.57% drop over the past week. This price drop brings Litecoin closer to its lower liquidity zone, increasing the risk of further downside if current support breaks.

The post Litecoin Key Support in Focus as Price Eyes Breakout Decision appeared first on Blockonomi.
This articles is written by : Nermeen Nabil Khear Abdelmalak
All rights reserved to : USAGOLDMIES . www.usagoldmines.com
You can Enjoy surfing our website categories and read more content in many fields you may like .
Why USAGoldMines ?
USAGoldMines is a comprehensive website offering the latest in financial, crypto, and technical news. With specialized sections for each category, it provides readers with up-to-date market insights, investment trends, and technological advancements, making it a valuable resource for investors and enthusiasts in the fast-paced financial world.