TLDR
- Solana’s network is experiencing massive growth with over 5 million new addresses being created daily, coinciding with a 4.4% price increase in 24 hours
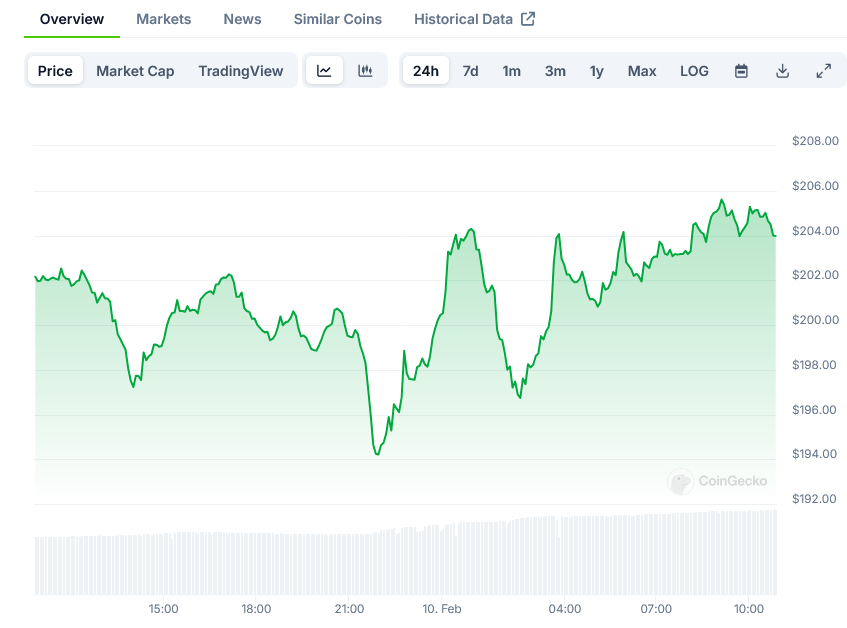
- Technical analysis shows SOL trading in an uptrend channel since July 2024, with current price around $204 after rebounding from support levels
- Long positions have increased notably, indicating growing bullish sentiment among traders and sustained buying pressure in the market
- SOL recently hit an all-time high of $293 on January 19, 2025, partly driven by the launch of the Official Trump meme coin on the Solana blockchain
- The current technical outlook suggests a potential price target of $387-389 if the uptrend channel holds, though the asset has pulled back 30% from its recent peak
The Solana blockchain network is experiencing unprecedented growth, with daily new address creation surpassing 5 million, according to recent Glassnode data. This surge in network activity comes as SOL’s price shows signs of recovery, currently trading at $204 after bouncing from crucial support levels.
The expansion of new addresses represents a fundamental shift in network adoption, marking a new phase of growth for the Solana ecosystem. Data analysis reveals this growth trend has maintained consistency throughout early 2025, suggesting sustained user interest rather than temporary spikes.
Market data indicates SOL has gained 4.4% in the past 24 hours, demonstrating resilience after a period of correction. The price movement follows a broader pattern observed since July 2024, with SOL trading within an upward channel characterized by higher lows and higher highs.
The recent price action becomes particularly noteworthy in the context of SOL’s all-time high of $293, reached on January 19, 2025. This peak coincided with increased attention following the launch of the Official Trump meme coin on the Solana blockchain, which helped drive momentum in the market.
Technical analysis from crypto analyst Ali Martinez highlights the importance of current price levels. Martinez notes that SOL’s position within its parallel channel could determine its next major move, with the upper boundary suggesting a potential target of $387.
#Solana $SOL is testing a key support level at the lower boundary of this parallel channel. Holding above it could strengthen the uptrend, fueling an upswing to $387! pic.twitter.com/eZdpGCZkxr
— Ali (@ali_charts) February 8, 2025
The increase in long positions, as shown by the Long/Short Ratio chart, indicates growing confidence among traders. This metric reveals that more market participants are taking bullish positions, contributing to sustained buying pressure in the market.
Open Interest data supports this bullish narrative, showing an overall increase that suggests new capital entering the market. This metric is particularly important as it indicates that price movements are backed by genuine investment rather than mere speculation.
The RSI (Relative Strength Index) currently sits at 64.59, approaching but not yet in overbought territory. This technical indicator suggests room for further upward movement, though traders should remain aware of potential short-term volatility.

Following the recent all-time high, SOL experienced a 30% correction, bringing prices back to test the lower boundary of the established uptrend channel. The subsequent bounce from these levels has reinforced the technical significance of this support zone.
The correlation between network growth and price action provides insights into market dynamics. Historical data shows that periods of increased address creation often precede or coincide with price appreciation, making the current surge in new addresses particularly relevant.
The Fibonacci extension indicator, calculated from the August 2024 low of $109, aligns with Martinez’s analysis. The 1.272 extension level corresponds with the $389 price target, adding another layer of technical validation to this potential price objective.
Market structure analysis reveals the formation of higher lows since July 2024, establishing a clear uptrend pattern. This technical formation suggests continued bullish momentum as long as key support levels hold.
Short-term price action shows consolidation near current levels, with trading volume patterns indicating accumulation. This behavior often precedes new price movements, though direction depends on broader market conditions and technical breakouts.
Recent data from Coinglass shows increasing institutional interest, with derivatives markets showing healthy activity levels. This metric often serves as a leading indicator for potential price movements in the spot market.
The latest network statistics show robust transaction volumes accompanying the growth in new addresses. At press time, SOL trades at $204, maintaining its position above crucial support levels while market participants await potential catalysts for the next major move.
The post Solana (SOL) Price: Rebounds from Support as Daily Active Addresses Surge Past 5 Million appeared first on Blockonomi.
This articles is written by : Nermeen Nabil Khear Abdelmalak
All rights reserved to : USAGOLDMIES . www.usagoldmines.com
You can Enjoy surfing our website categories and read more content in many fields you may like .
Why USAGoldMines ?
USAGoldMines is a comprehensive website offering the latest in financial, crypto, and technical news. With specialized sections for each category, it provides readers with up-to-date market insights, investment trends, and technological advancements, making it a valuable resource for investors and enthusiasts in the fast-paced financial world.