
TLDR
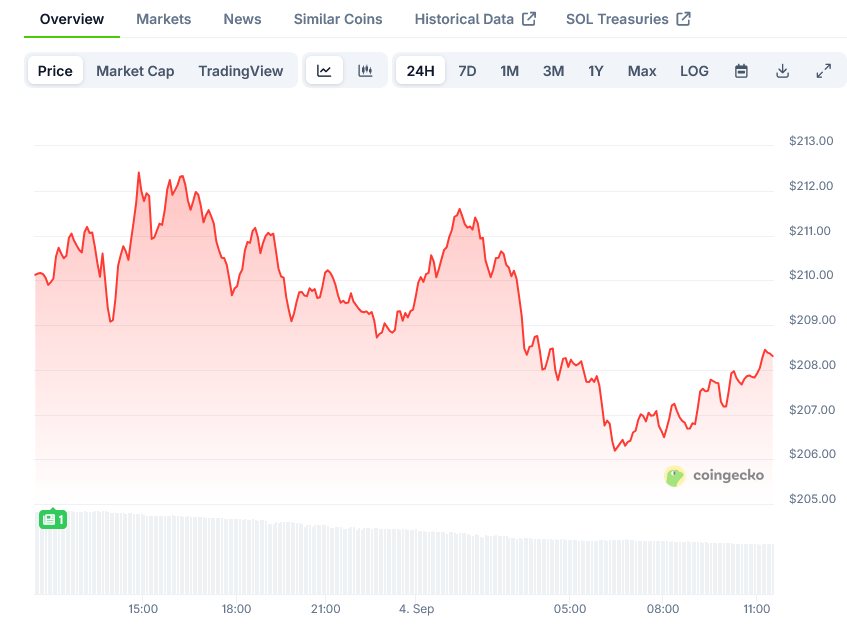
- SOL price recovering from $194 zone, now trading above $200 and the 100-hourly moving average
- Price faces significant resistance at $212 level with bears actively defending this zone
- Long-term holders appear to be reducing positions with Hodler Net Position Change dropping below -1.5M SOL
- Net Unrealized Profit/Loss (NUPL) increased from 0.26 to 0.30, approaching levels that preceded previous pullbacks
- Despite 30% monthly gain, price action has flattened within $205-$215 range with sharp pullbacks
Solana has been showing recovery signs after testing the $194 support level, but the cryptocurrency faces tough resistance that could determine its next major move. The price is currently hovering above $210, with traders watching key technical levels to gauge whether bulls can sustain momentum or if profit-taking will trigger another correction.
The SOL price started a recovery wave after testing the $194-$195 zone. This bounce mirrors broader market movements seen in other cryptocurrencies like Bitcoin and Ethereum.
During this recovery, Solana managed to climb above several key levels including $200 and $202. The price moved past the 50% Fibonacci retracement level of the downward move from the $218 swing high to the $194 low.
However, the upward momentum has stalled as bears appear active near the $212 resistance zone. The price reacted to the downside below $210 after approaching this level.
Technical analysis shows a break below a connecting bullish trend line with support at $207 on the hourly chart of the SOL/USD pair. Despite this breakdown, Solana continues trading above $204 and the 100-hourly simple moving average.
On the upside, the price faces immediate resistance near $210, with the next major barrier at $212. This level aligns with the 76.4% Fibonacci retracement of the recent downward move.
If Solana breaks above $212, the next resistance stands at $218. A successful close above this zone could trigger another steady increase, potentially pushing the price toward $232 and eventually $245.
On-Chain Metrics Show Profit-Taking Risk
Several on-chain metrics suggest caution for SOL bulls. The Net Unrealized Profit/Loss (NUPL) metric, which measures overall market profitability, has climbed approximately 15.4% in the past day, moving from 0.26 to 0.30.
This NUPL reading is forming another local peak, and previous peaks have consistently aligned with price corrections. On August 28, when NUPL reached similar levels, Solana corrected from $214 to $205—a drop of 4.2%. Earlier in August, a NUPL of 0.30 preceded an 8% price decline.
With NUPL once again approaching a local high while Solana trades near $210, the setup suggests another wave of profit-taking could emerge soon.
The Hodler Net Position Change metric provides even more cause for concern. This indicator tracks whether long-term holders are adding or reducing positions, and it has dropped sharply into negative territory, crossing below -1.5 million SOL.
This negative reading indicates long-term investors are reducing exposure even as prices trend higher—creating a bearish divergence that often precedes deeper corrections.
Price Action Reflects Market Hesitation
Despite a 30% monthly price increase, Solana has struggled to maintain momentum, with price action flattening within the $205-$215 range. Bounces have failed to convert into sustained rallies.
If Solana fails to rise above the $212 resistance, downside movement may continue. Initial support sits near $204, with major support at the $200 psychological level.
A break below $200 could send the price toward the $195 support zone. Further weakness below this level might push SOL toward $184 in the near term.
For the uptrend to continue, Solana needs a clean breakout above the $215-$220 zone. This would invalidate the correction-focused outlook and potentially restart the broader bullish trend.
The Money Flow Index, which measures capital inflows and outflows relative to price, has been trending lower even as price attempted to bounce. This divergence suggests weaker buying pressure, with new money not flowing in aggressively enough to support higher prices.
Solana currently trades just above $210 after its monthly rise, with key downside levels at $194 if $204 breaks.
Technical indicators show mixed signals. The MACD for SOL/USD is losing pace in the bullish zone, while the Hourly RSI has dipped below the 50 level, indicating weakening momentum.
The combination of high unrealized profits, long-term investors cashing out, and weakening dip-buying presents challenging conditions for Solana’s price in the short term.
The post Solana (SOL) Price: Recovery Rally Faces Key Resistance at $212 Level appeared first on Blockonomi.
This articles is written by : Nermeen Nabil Khear Abdelmalak
All rights reserved to : USAGOLDMIES . www.usagoldmines.com
You can Enjoy surfing our website categories and read more content in many fields you may like .
Why USAGoldMines ?
USAGoldMines is a comprehensive website offering the latest in financial, crypto, and technical news. With specialized sections for each category, it provides readers with up-to-date market insights, investment trends, and technological advancements, making it a valuable resource for investors and enthusiasts in the fast-paced financial world.