Solana (SOL) has seen a fresh increase from the $100 support zone, gaining over 12% but facing resistance at $120
Technical indicators show mixed signals with RSI at 45.52, suggesting recovery but lacking strong buyer conviction
SOL is forming a potentially bullish cup and handle pattern, though currently experiencing selling pressure
The cryptocurrency has a current market cap of approximately $66.15 billion, with a fixed supply that makes it sensitive to institutional buying
Experts project SOL could reach $3,211 by 2030, though 2025 is forecasted to enter a bearish cycle
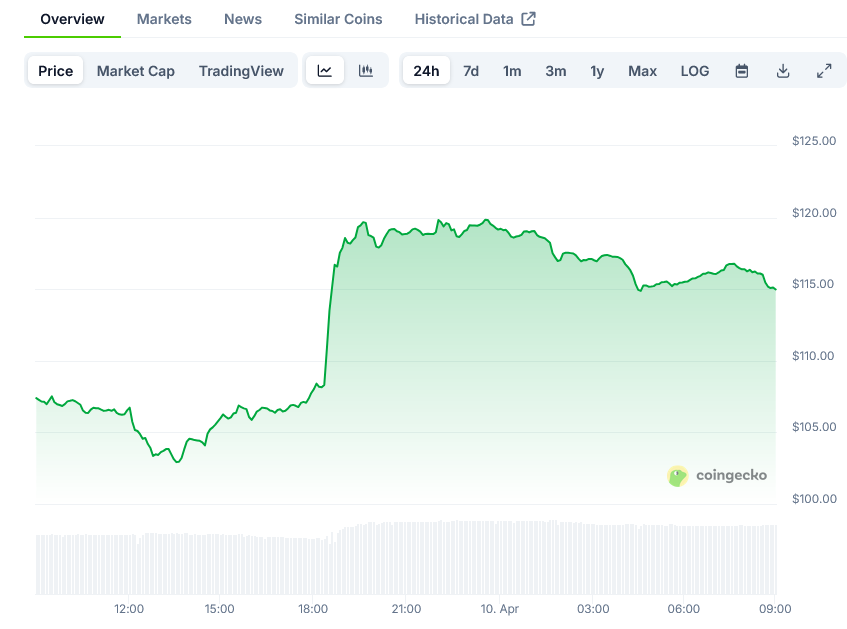
Solana (SOL) has staged a significant recovery, jumping more than 12% after recently forming a base above the $100 support zone. The cryptocurrency, known for its high-performance blockchain platform, is now trading above $105 and the 100-hourly simple moving average, but appears to be consolidating as it approaches key resistance levels.
The price increase coincided with a broader market recovery following an announcement of a 90-day pause on tariffs by President Trump. Despite this positive catalyst, Solana is now facing strong resistance around the $120 mark.
Technical analysis shows SOL broke above a bearish trend line with resistance at $107 on the hourly chart. The cryptocurrency even spiked toward the $120 resistance zone, forming a high at $120.10 before retreating.
Solana’s technical indicators present a nuanced picture of its current market position. The Relative Strength Index (RSI) sits at 45.52, hovering in neutral territory but remaining below the midline of 50 for nearly two days.
This comes after the RSI briefly dipped to an oversold level of 21.53 two days ago. The slow climb back toward neutral suggests that while extreme selling pressure has eased, bullish momentum has not yet fully taken control.
Adding to the technical assessment, the BBTrend indicator is currently at -14.19, having turned negative since yesterday. This is its lowest level since March 13—nearly a month ago.
The shift into deeper negative territory suggests that bearish momentum may be building once again after a period of relative stability. This could indicate growing downside pressure if follow-through selling continues in the short term.
Market Context and Support Levels
Solana currently boasts a market capitalization of approximately $66.15 billion, making it one of the leading cryptocurrencies by market value. Its historical resilience has been tested by sharp price swings during previous bear markets, yet SOL has demonstrated strength by bouncing back quickly after each dip.
If SOL fails to rise above the $118-$120 resistance zone, it could initiate another decline. Initial support on the downside is near the $112 zone, with the first major support near the $110 level.
This corresponds to the 50% Fibonacci retracement level of the upward move from the $101.24 swing low to the $120.10 high. A break below $110 might send the price toward the $105 zone, with further potential decline toward $100 if selling pressure persists.
On the upside, if Solana can successfully close above the $125 resistance zone, it could set the pace for another steady increase. The next key resistance would be at $132, with potential for movement toward the $140 level if buying pressure increases.
Solana’s staking rate currently surpasses 5%, reflecting confidence in the long-term health of the network. Additionally, network upgrades like Token Extensions continue to drive developer adoption and user engagement.
The fixed supply of SOL makes it particularly sensitive to institutional buying, which often pushes the price up significantly during accumulation phases. This dynamic makes technical analysis an indispensable tool during volatile or bearish market phases.
Experts predict that SOL may reach as high as $3,211 by 2030, backed by its potential to onboard over 100 million users through decentralized applications. However, traders should remain cautious, as 2025 is forecasted to enter a bearish cycle according to some market watchers.
For short-term strategies, price dips may offer accumulation opportunities, while long-term holders could benefit from ecosystem growth and increasing utility of the Solana blockchain.
Whether trading daily or investing for the long term, regularly reviewing market data enables better judgment. Solana’s combination of high throughput, vibrant development activity, and institutional interest continues to make it a leading choice among crypto investors seeking both growth potential and practical utility.
The cryptocurrency is currently forming a cup and handle pattern—historically considered a bullish indicator. If this pattern plays out as expected, Solana could potentially break out to higher price levels in the coming weeks.
Solana’s market movements are influenced by network activity, demand-supply dynamics, staking metrics, and the broader economic climate. The macroeconomic environment—especially regulation and global liquidity—also plays a pivotal role in determining price direction.
To stay informed about Solana’s price movements, traders rely on tools like crypto exchanges, wallet analyzers, and market insight platforms that provide in-depth technical analysis. These platforms offer up-to-date information on staking trends, gas fees, wallet flows, and broader economic indicators that impact SOL.
This articles is written by : Nermeen Nabil Khear Abdelmalak
All rights reserved to : USAGOLDMIES . www.usagoldmines.com
You can Enjoy surfing our website categories and read more content in many fields you may like .
Why USAGoldMines ?
USAGoldMines is a comprehensive website offering the latest in financial, crypto, and technical news. With specialized sections for each category, it provides readers with up-to-date market insights, investment trends, and technological advancements, making it a valuable resource for investors and enthusiasts in the fast-paced financial world.