Solana (SOL) recently bounced from $95.2 to over $120, registering a growth of more than 16.7%
A veteran whale purchased 32,000 SOL worth approximately $3.72 million after a six-month hiatus
SOL broke through the $120 resistance level with a 10% surge in price
Technical analysis shows SOL formed a falling wedge pattern since November 2024
Next resistance levels are at $125, $132, and potentially $140
Solana’s native token SOL has staged a strong recovery in recent days, climbing above the $120 mark after finding support near $95. The upward movement comes amid renewed interest from large investors and shifting market sentiment despite ongoing economic tensions between the United States and China.
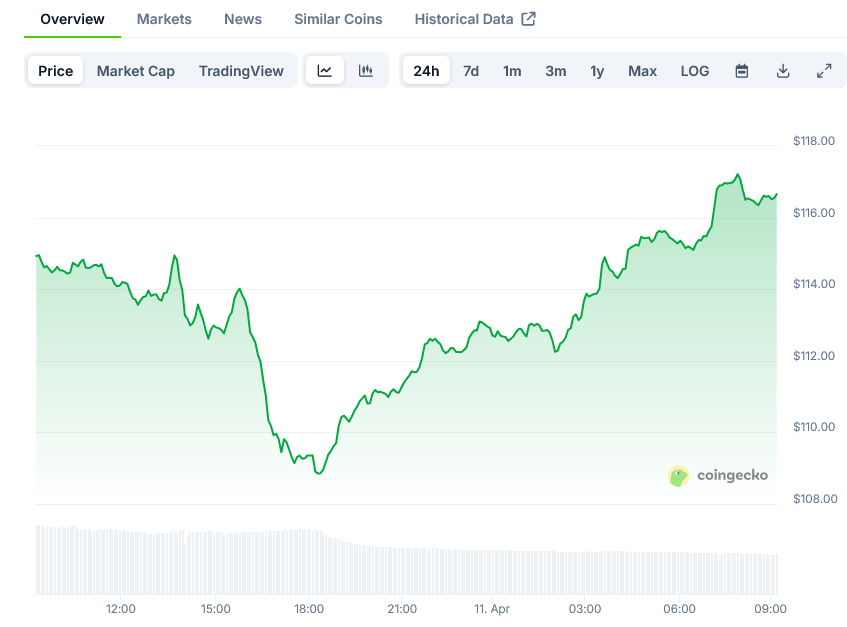
SOL jumped more than 10% in the latest trading session, continuing its bounce from the $95.2 support level established earlier this month. The token is currently trading around $120, though it remains down across longer timeframes.
The price action follows months of consolidation within a falling wedge pattern that began forming in November 2024.
Solana $SOL is currently testing the range Value Area Low (VAL) at $116
If it can flip this level into support, it could make a run towards the range Point of Control (POC) at $142 pic.twitter.com/XOfXWR0Q9y
A key catalyst for SOL’s recent strength appears to be the return of a major investor to the market. According to blockchain analytics firm LookOnChain, a veteran Solana whale purchased 32,000 SOL tokens worth approximately $3.72 million after a six-month break from buying.
What makes this whale particularly interesting is their history with the token. The same investor purchased 30,541 SOL for $6.61 million three years ago when the token was trading at $216.
Perhaps most impressively, this investor held through SOL’s dramatic collapse to under $10 following the FTX exchange implosion.
A whale bought another 32,000 $SOL($3.72M) after 6 months.
Such conviction from deep-pocketed investors tends to provide stability to crypto assets during periods of market uncertainty.
The whale’s return comes at a critical time for SOL, which had been showing signs of weakness after falling 6.5% during a recent U.S. trading session.
Technical Outlook Points to Higher Levels
From a technical analysis perspective, SOL’s price chart is showing promising signs of a potential trend reversal.
On April 6th, the token appeared to break down below its yearly support of $112, which also coincided with a critical Fibonacci retracement level.
However, this move turned out to be a false breakdown, as buyers quickly stepped in and pushed the price back above this key threshold.
The daily chart shows SOL has been trading within a falling wedge pattern since November 2024, with price confined between two converging trendlines.
This pattern often precedes a bullish breakout, and the recent price action suggests SOL may be preparing to breach the pattern’s upper resistance trendline.
A successful break above the overhead resistance could signal a change in market sentiment and potentially drive a rally toward the $180 level.
Key Resistance and Support Levels to Watch
Traders are closely monitoring several key price levels that could determine SOL’s next major move.
The token faces major resistance at the $125 level, followed by $132 and potentially $140 if bullish momentum continues.
A successful breakthrough above $125 would confirm the bullish trend and signal the continuation of the current upward movement.
On the support side, $112 and $110 represent the first lines of defense if selling pressure returns. These levels correspond to previous resistance points and Fibonacci retracement markers.
Should these supports fail to hold, SOL might revisit the $105 and $100 zones, both of which have proven pivotal in recent market activity.
Holding above the $105 level remains critical for maintaining bullish sentiment, as a drop below could attract short sellers and weaken the asset’s momentum.
The $100 mark represents the ultimate line of protection for SOL in the short term.
Technical indicators present a mixed picture, with the MACD on the hourly chart showing decreasing momentum while the Relative Strength Index remains above the 50 mark, indicating weak but persistent bullish pressure.
SOL’s recent price bounce occurs against a backdrop of broader market developments, including President Donald Trump’s announcement of a 90-day pause on tariffs for most countries except China.
The cryptocurrency market has also reacted positively to the U.S. Senate’s confirmation of Paul Atkins as the new SEC chair, replacing Gary Gensler who faced criticism from the crypto community.
Despite the recent rally, SOL remains down by 1.9% on the weekly charts and has declined 33% since April 2024. The token hit its most recent all-time high of $293.31 in January of this year.
This articles is written by : Nermeen Nabil Khear Abdelmalak
All rights reserved to : USAGOLDMIES . www.usagoldmines.com
You can Enjoy surfing our website categories and read more content in many fields you may like .
Why USAGoldMines ?
USAGoldMines is a comprehensive website offering the latest in financial, crypto, and technical news. With specialized sections for each category, it provides readers with up-to-date market insights, investment trends, and technological advancements, making it a valuable resource for investors and enthusiasts in the fast-paced financial world.
pic.twitter.com/XOfXWR0Q9y
