
Bitcoin price failed to continue higher above $94,000. BTC is now gaining bearish pace and might decline further below $89,500.
- Bitcoin started a downside correction from the $94,500 zone.
- The price is trading below $92,000 and the 100 hourly Simple moving average.
- There was a break below a bullish trend line with support at $91,600 on the hourly chart of the BTC/USD pair (data feed from Kraken).
- The pair might continue to move down if it settles below the $89,500 zone.
Bitcoin Price Dips Again
Bitcoin price failed to gain strength for a move above the $94,000 and $94,500 levels. BTC started a downside correction and traded below the $92,000 support.
There was a clear move below the 50% Fib retracement level of the upward move from the $87,777 swing low to the $94,583 high. Besides, there was a break below a bullish trend line with support at $91,600 on the hourly chart of the BTC/USD pair.
Bitcoin is now trading below $91,200 and the 100 hourly Simple moving average. The price is now approaching the $89,500 support, and the 76.4% Fib retracement level of the upward move from the $87,777 swing low to the $94,583 high.
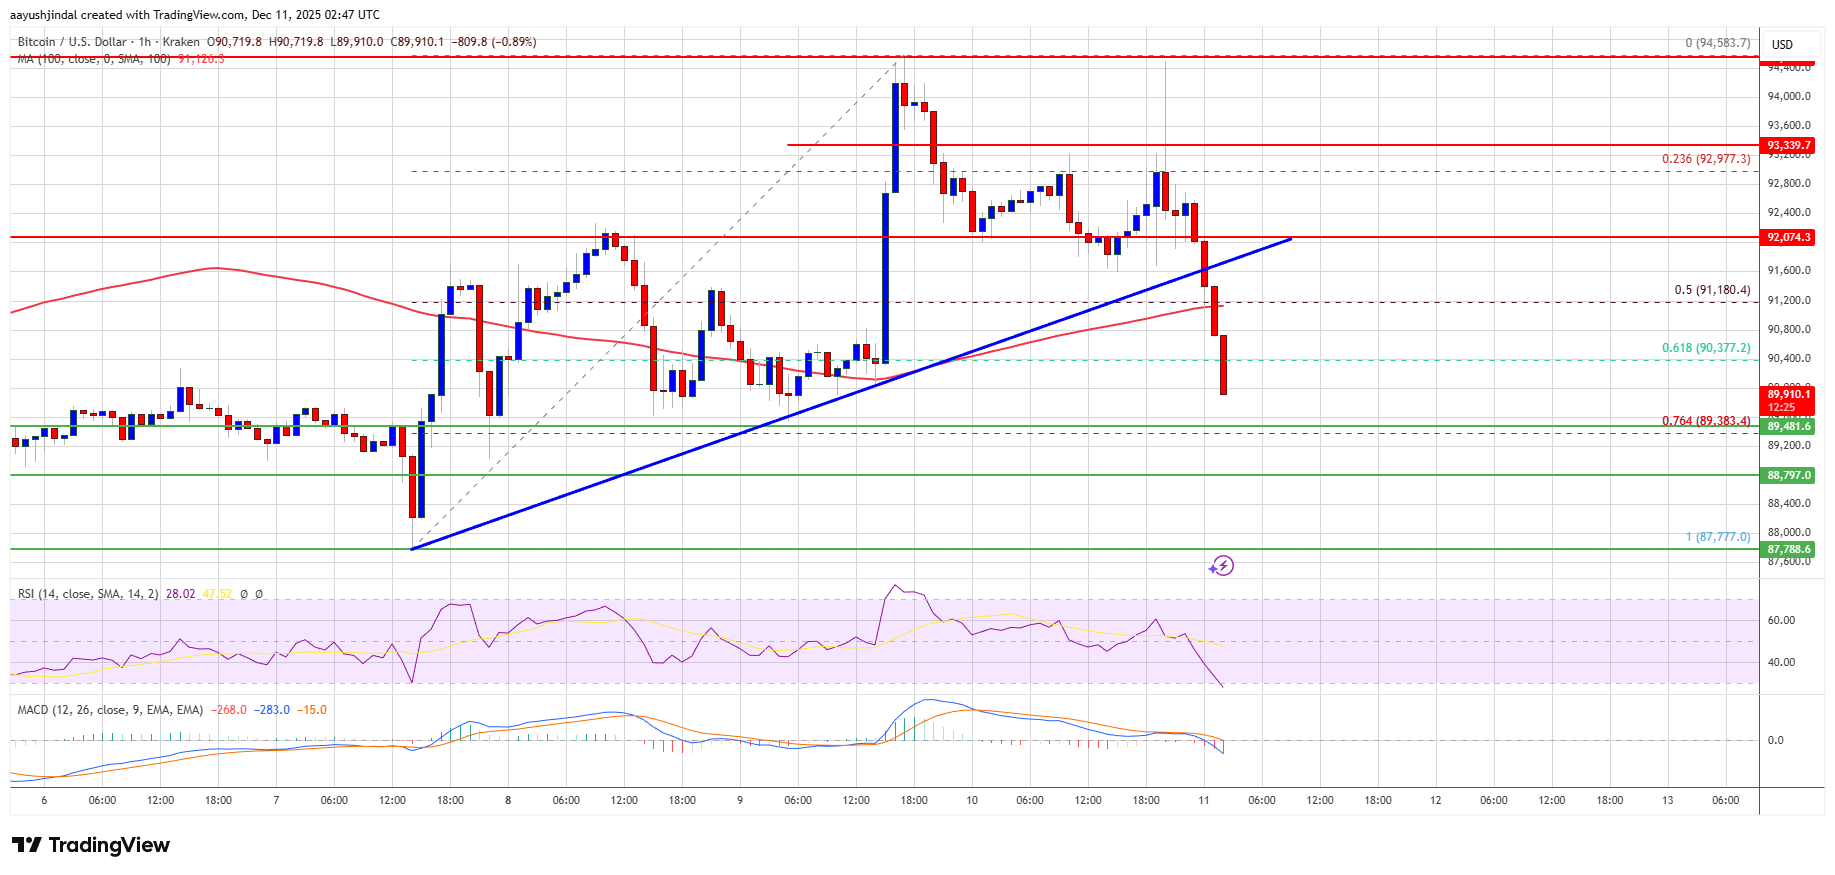
If the bulls remain in action, the price could attempt another increase. Immediate resistance is near the $91,200 level. The first key resistance is near the $91,500 level. The next resistance could be $92,000. A close above the $92,000 resistance might send the price further higher. In the stated case, the price could rise and test the $92,850 resistance. Any more gains might send the price toward the $93,500 level. The next barrier for the bulls could be $94,000 and $94,500.
More Losses In BTC?
If Bitcoin fails to rise above the $92,000 resistance zone, it could start another decline. Immediate support is near the $89,500 level. The first major support is near the $88,800 level.
The next support is now near the $87,750 zone. Any more losses might send the price toward the $86,500 support in the near term. The main support sits at $85,000, below which BTC might accelerate lower in the near term.
Technical indicators:
Hourly MACD – The MACD is now gaining pace in the bearish zone.
Hourly RSI (Relative Strength Index) – The RSI for BTC/USD is now below the 50 level.
Major Support Levels – $89,500, followed by $88,800.
Major Resistance Levels – $91,200 and $92,000.
This articles is written by : Nermeen Nabil Khear Abdelmalak
All rights reserved to : USAGOLDMIES . www.usagoldmines.com
You can Enjoy surfing our website categories and read more content in many fields you may like .
Why USAGoldMines ?
USAGoldMines is a comprehensive website offering the latest in financial, crypto, and technical news. With specialized sections for each category, it provides readers with up-to-date market insights, investment trends, and technological advancements, making it a valuable resource for investors and enthusiasts in the fast-paced financial world.