
After failing to reclaim key resistance zones, Bitcoin continues to show weakness across multiple timeframes. The market remains under pressure as buyers struggle to step in with strength, while broader sentiment and derivatives data hint at further downside risk in the short term.
Technical Analysis
By Shayan
The Daily Chart
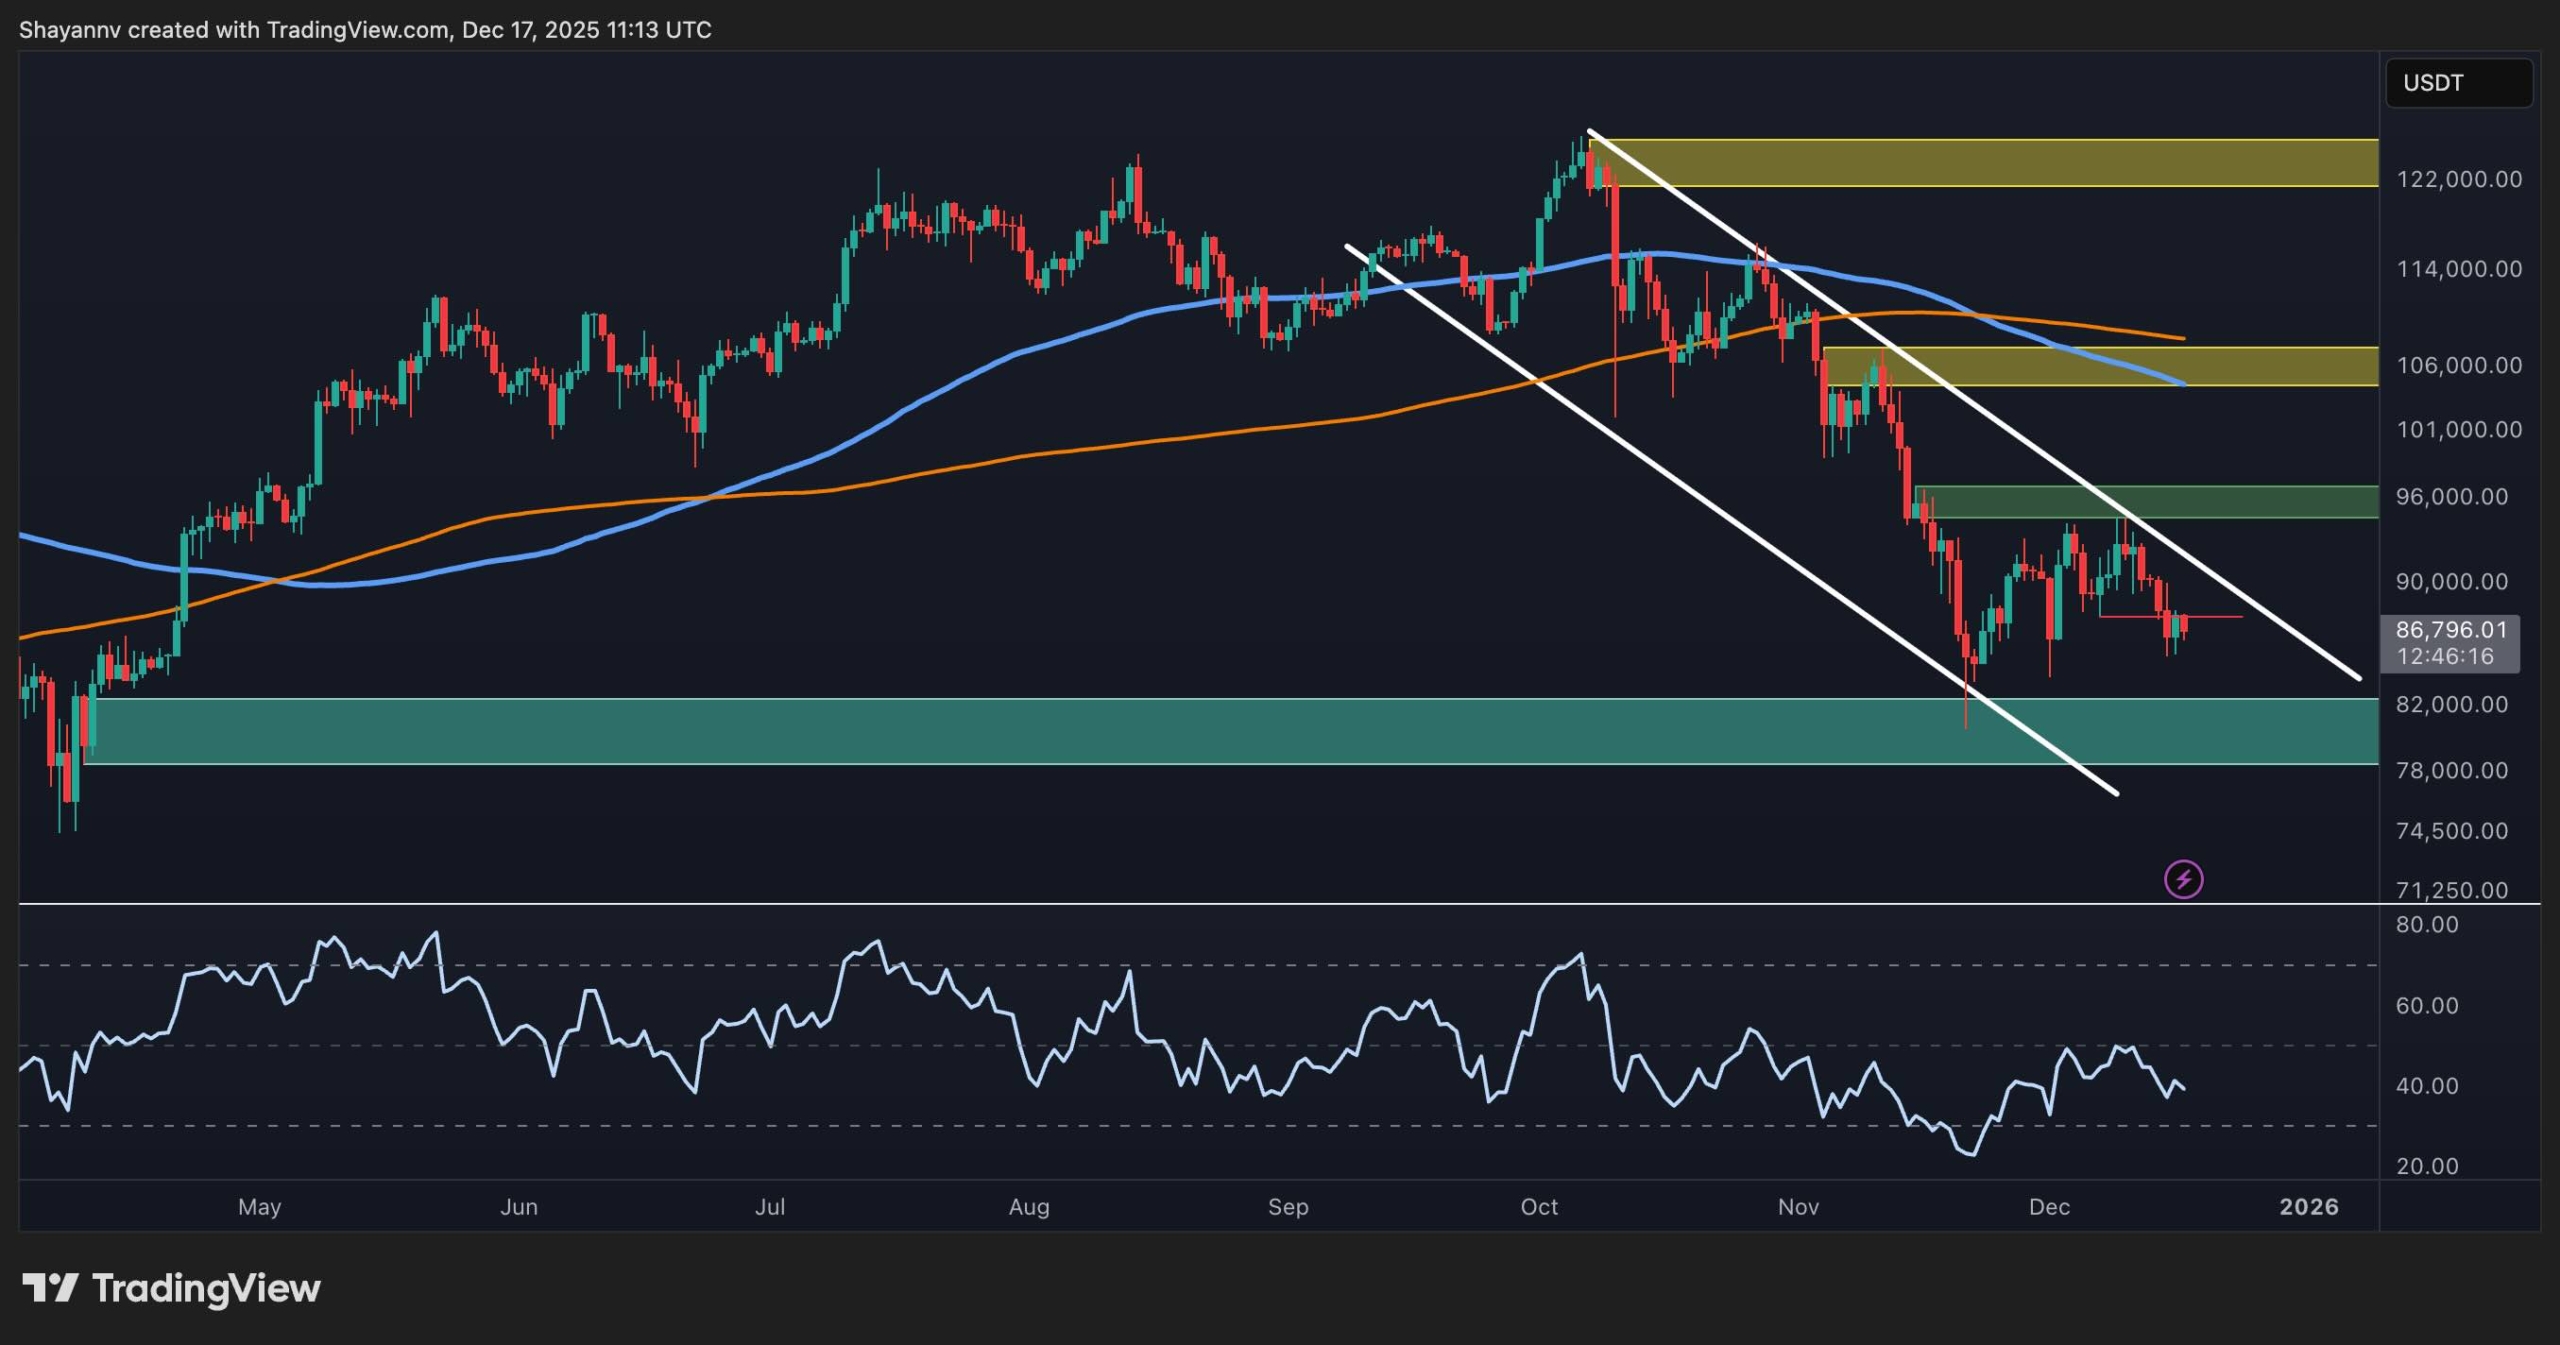
On the daily chart, BTC remains locked inside a well-defined descending channel. The recent rejection near the channel’s higher boundary, around the $90K mark, confirms continued bearish control. The asset is now hovering around $87K, with the 200-day and 100-day moving averages acting as dynamic resistance just above $100K.
As attempts to reclaim the $96K–97K supply zone failed, the structure remains bearish unless price can break and hold above that level. For now, the next key demand zone sits at the $80K area. Meanwhile, momentum remains weak, with RSI unable to push above 50, making more downside likely in the short term.
The 4-Hour Chart
The 4H chart shows a clear breakdown from the ascending wedge pattern that had formed over the past few weeks. After multiple rejections at the $95K resistance zone, BTC finally broke down from the wedge and is now trading below both the wedge support and short-term range.
The current structure is bearish, and any retest of $88K–$89K zone may act as a short-term resistance before further downside continuation. With the RSI also showing a bearish momentum reset and no signs of bullish divergence, a drop toward the $80K demand zone is the most probable scenario.

Sentiment Analysis
Bitcoin Open Interest
Open Interest continues to trend lower, falling from its peak. The chart shows a sharp decline in leverage as BTC price dropped below $90K, suggesting long liquidations and an ongoing reduction in speculative exposure.
This persistent decline in Open Interest while price grinds down reflects weak conviction from bulls and a lack of new leveraged longs entering the market. Historically, a large open interest flush followed by a clean reset is needed for the price to bottom. This has not been seen yet.
Until either a sharp liquidation event occurs or signs of new accumulation are seen, sentiment remains cautious, and the risk of another leg down remains elevated.

The post Bitcoin Price Analysis: How Low Can BTC Go After Latest Rejection at $90K? appeared first on CryptoPotato.
After failing to reclaim key resistance zones, Bitcoin continues to show weakness across multiple timeframes. The market remains under pressure as buyers struggle to step in with strength, while broader sentiment and derivatives data hint at further downside risk in the short term. Technical Analysis By Shayan The Daily Chart On the daily chart, BTC BTC Analysis, BTCEUR, BTCGBP, BTCUSD, BTCUSDT, Crypto News, Bitcoin (BTC) Price
This articles is written by : Nermeen Nabil Khear Abdelmalak
All rights reserved to : USAGOLDMIES . www.usagoldmines.com
You can Enjoy surfing our website categories and read more content in many fields you may like .
Why USAGoldMines ?
USAGoldMines is a comprehensive website offering the latest in financial, crypto, and technical news. With specialized sections for each category, it provides readers with up-to-date market insights, investment trends, and technological advancements, making it a valuable resource for investors and enthusiasts in the fast-paced financial world.