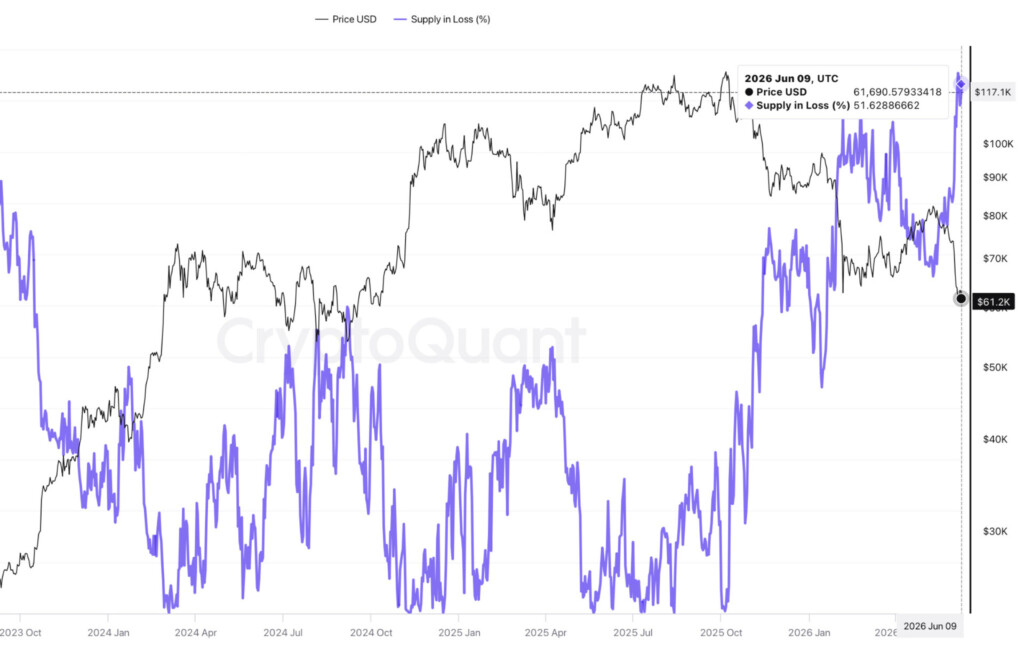
Just over half of all the Bitcoin in circulation today is now underwater, according to data from CryptoQuant. As of this writing, 51.6% of supply is sitting below its cost basis, a number that has climbed from 34% in roughly a month, leaving the market split almost evenly between coins in profit versus those at a loss. This level and this sort of split are a very rare occurrence in Bitcoin’s historical timeline and when it has shown up in the past, it has usually coincided near a floor for price.
What Supply in Loss Actually Measures
Every Bitcoin has a cost basis, the price it last moved at onchain. The supply in loss metric simply tracks the percentage of coins in circulation where the cost basis is above the current price of Bitcoin.
When the supply in loss percentage trends to the upside, it is basically a signal that more of the network is now holding at a loss and that these holders could either sell into weakness or decide to hold the line. This onchain data is far better than any sentiment analysis survey could capture because it actually tracks the movement of coins at a specific price point. It is therefore a great gauge for understanding how much pain the market is holding onto.
A month ago, about a third of the supply was in loss. Now it’s past half. That’s a fast deterioration, and it tends to shake out recent buyers first.
A 50% Reading Is Rare
Reliable price data for Bitcoin goes all the way back to 2010. During this entire period, BTC has spent around 93% of its days with more than half of supply in profit, according to onchainmind.io. The current reading is exceptionally rare in that regard.
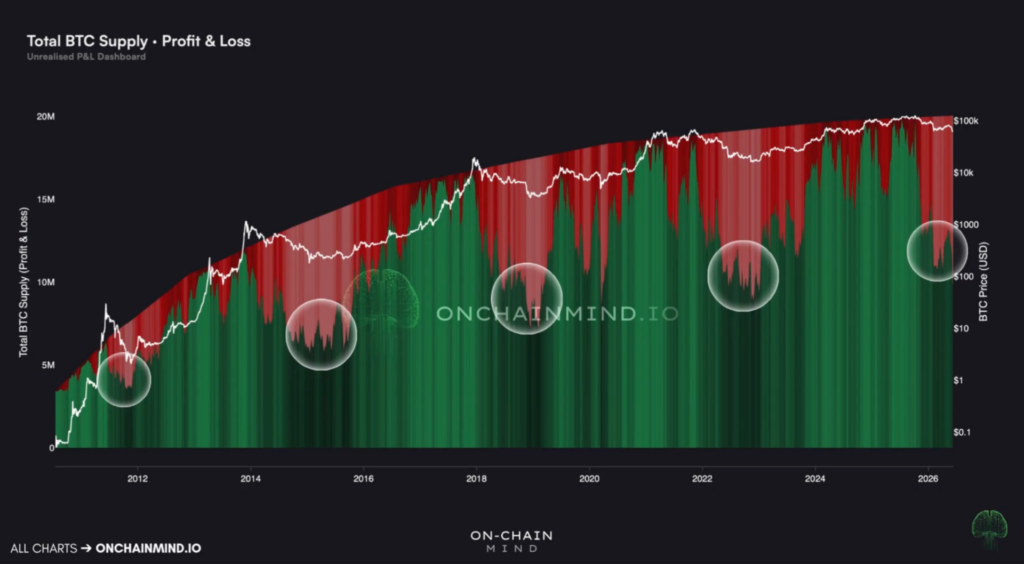
Source: Onchainmind
The handful of times when the readings have been split have proved to be inflection points for BTC price action. Each instance has clustered close to a major bear market bottom before a reversal. It showed up near the 2015 lows, there again during the 2018 capitulation and again in 2022 after the FTX collapse that drove prices to the lows of that cycle. This signal is flashing again now for the first time since then.
Don’t Wait for a V-Shape
The catch is what comes next. History doesn’t reward anyone expecting a sharp bounce off this level. When supply in loss has hit 50% in the past, Bitcoin hasn’t snapped back. It has ground sideways, sometimes for months, while the market absorbs the losses and ownership slowly changes hands.
That points to a time based capitulation rather than a price based one. Instead of one violent flush to a lower low, the market tends to wear down patience, chopping in a range until sellers are exhausted and there’s nobody left to sell. It’s a slower, grinding kind of bottom, and it tests conviction more than it tests price.
For now, the 50% reading puts Bitcoin in territory it rarely visits. The data doesn’t call a bottom on its own, but it says the market is closer to one than to a top and that the path through it is likely to be measured in weeks of chop rather than a single clean reversal.
Don’t just read crypto news. Understand it. Subscribe to our newsletter. It’s free.
This articles is written by : Nermeen Nabil Khear Abdelmalak
All rights reserved to : USAGOLDMIES . www.usagoldmines.com
You can Enjoy surfing our website categories and read more content in many fields you may like .
Why USAGoldMines ?
USAGoldMines is a comprehensive website offering the latest in financial, crypto, and technical news. With specialized sections for each category, it provides readers with up-to-date market insights, investment trends, and technological advancements, making it a valuable resource for investors and enthusiasts in the fast-paced financial world.