Quick Overview
- ETH declined 2.4% to $1,872 following a reversal after Consumer Price Index data release
- Exchange holdings increased marginally to 15.13 million ETH, indicating moderate distribution
- Small wallet holders distributed 160K ETH while large holders absorbed approximately 100K ETH recently
- Spot Ethereum ETFs in the United States attracted $244.9 million last week but experienced minor outflows this week
- Critical support level established at $1,875, with overhead resistance concentrated in the $1,920–$1,955 zone
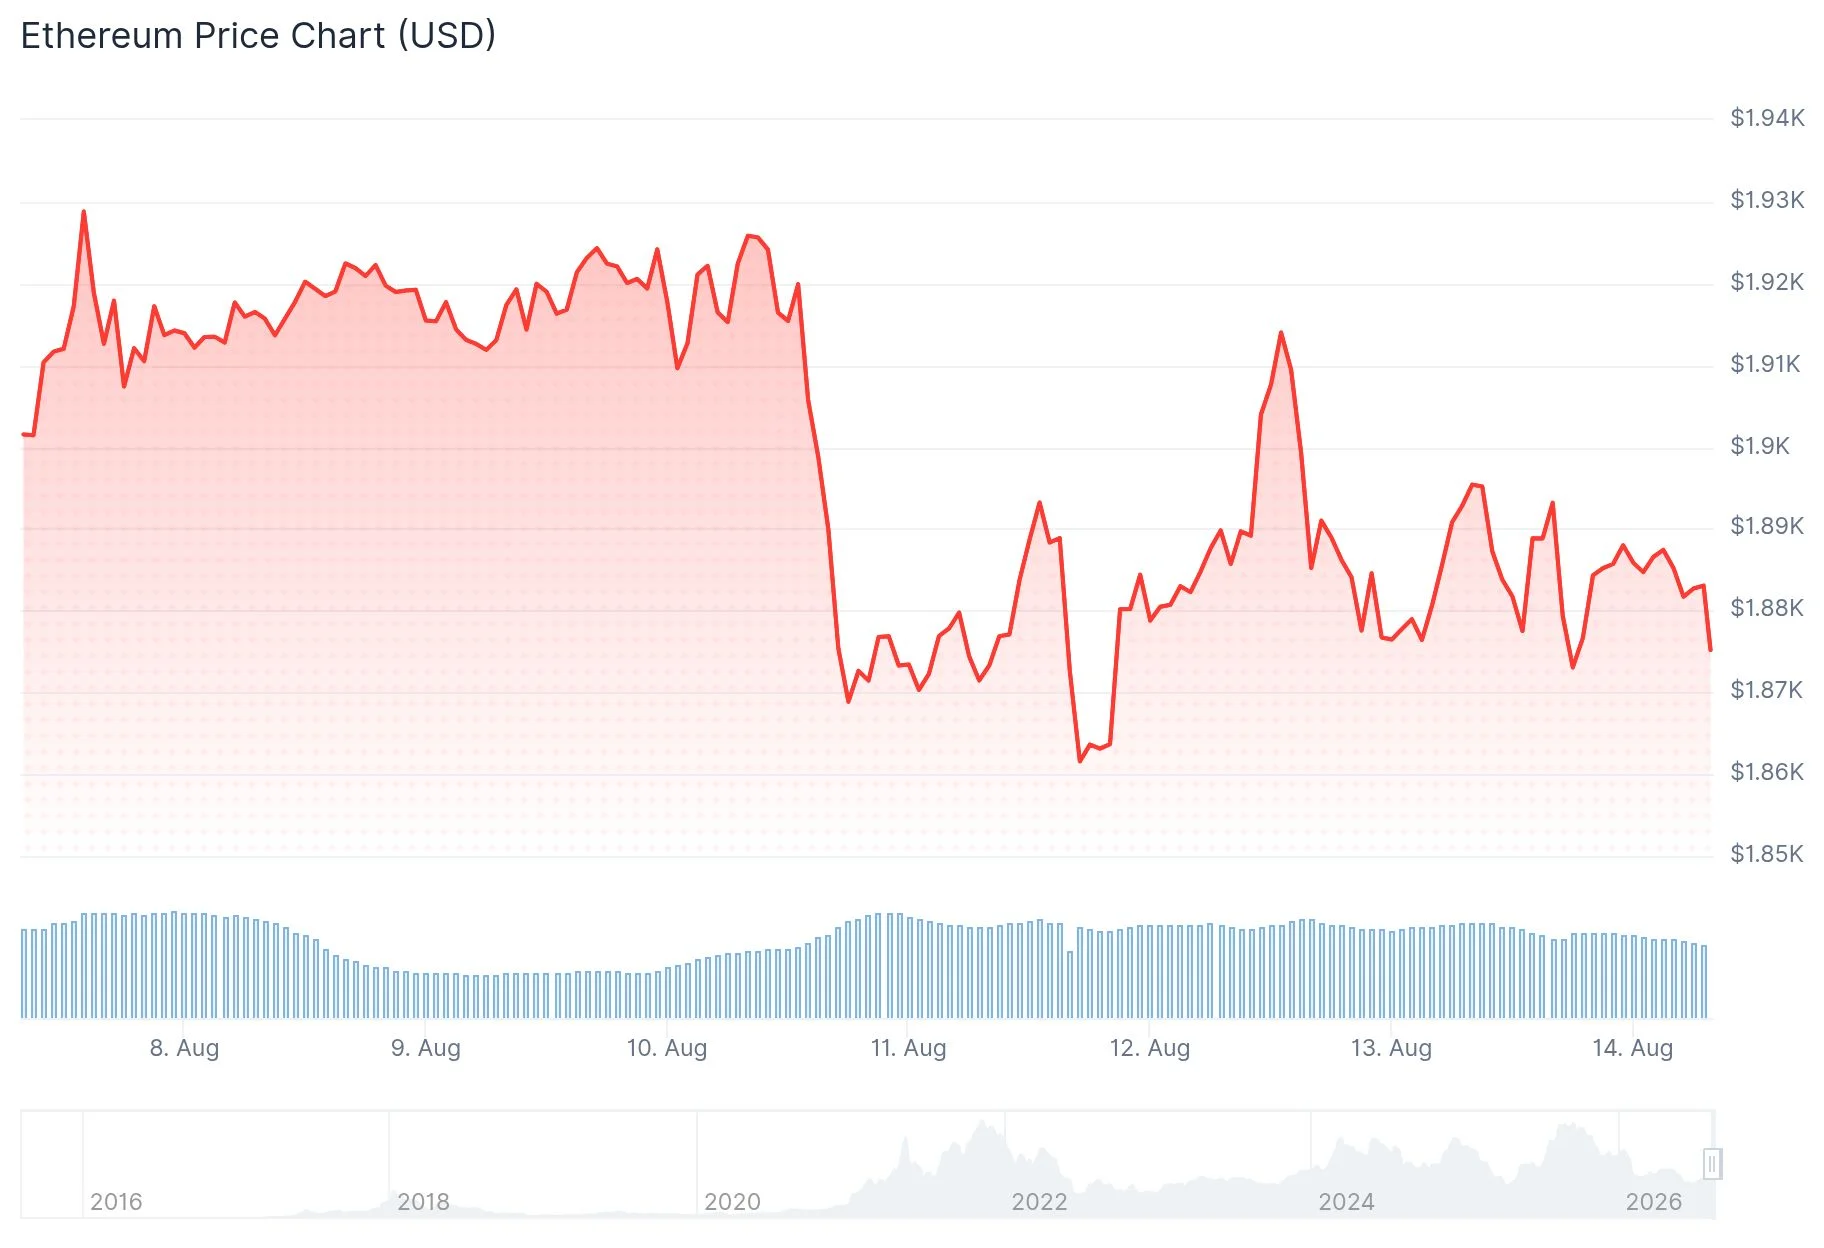
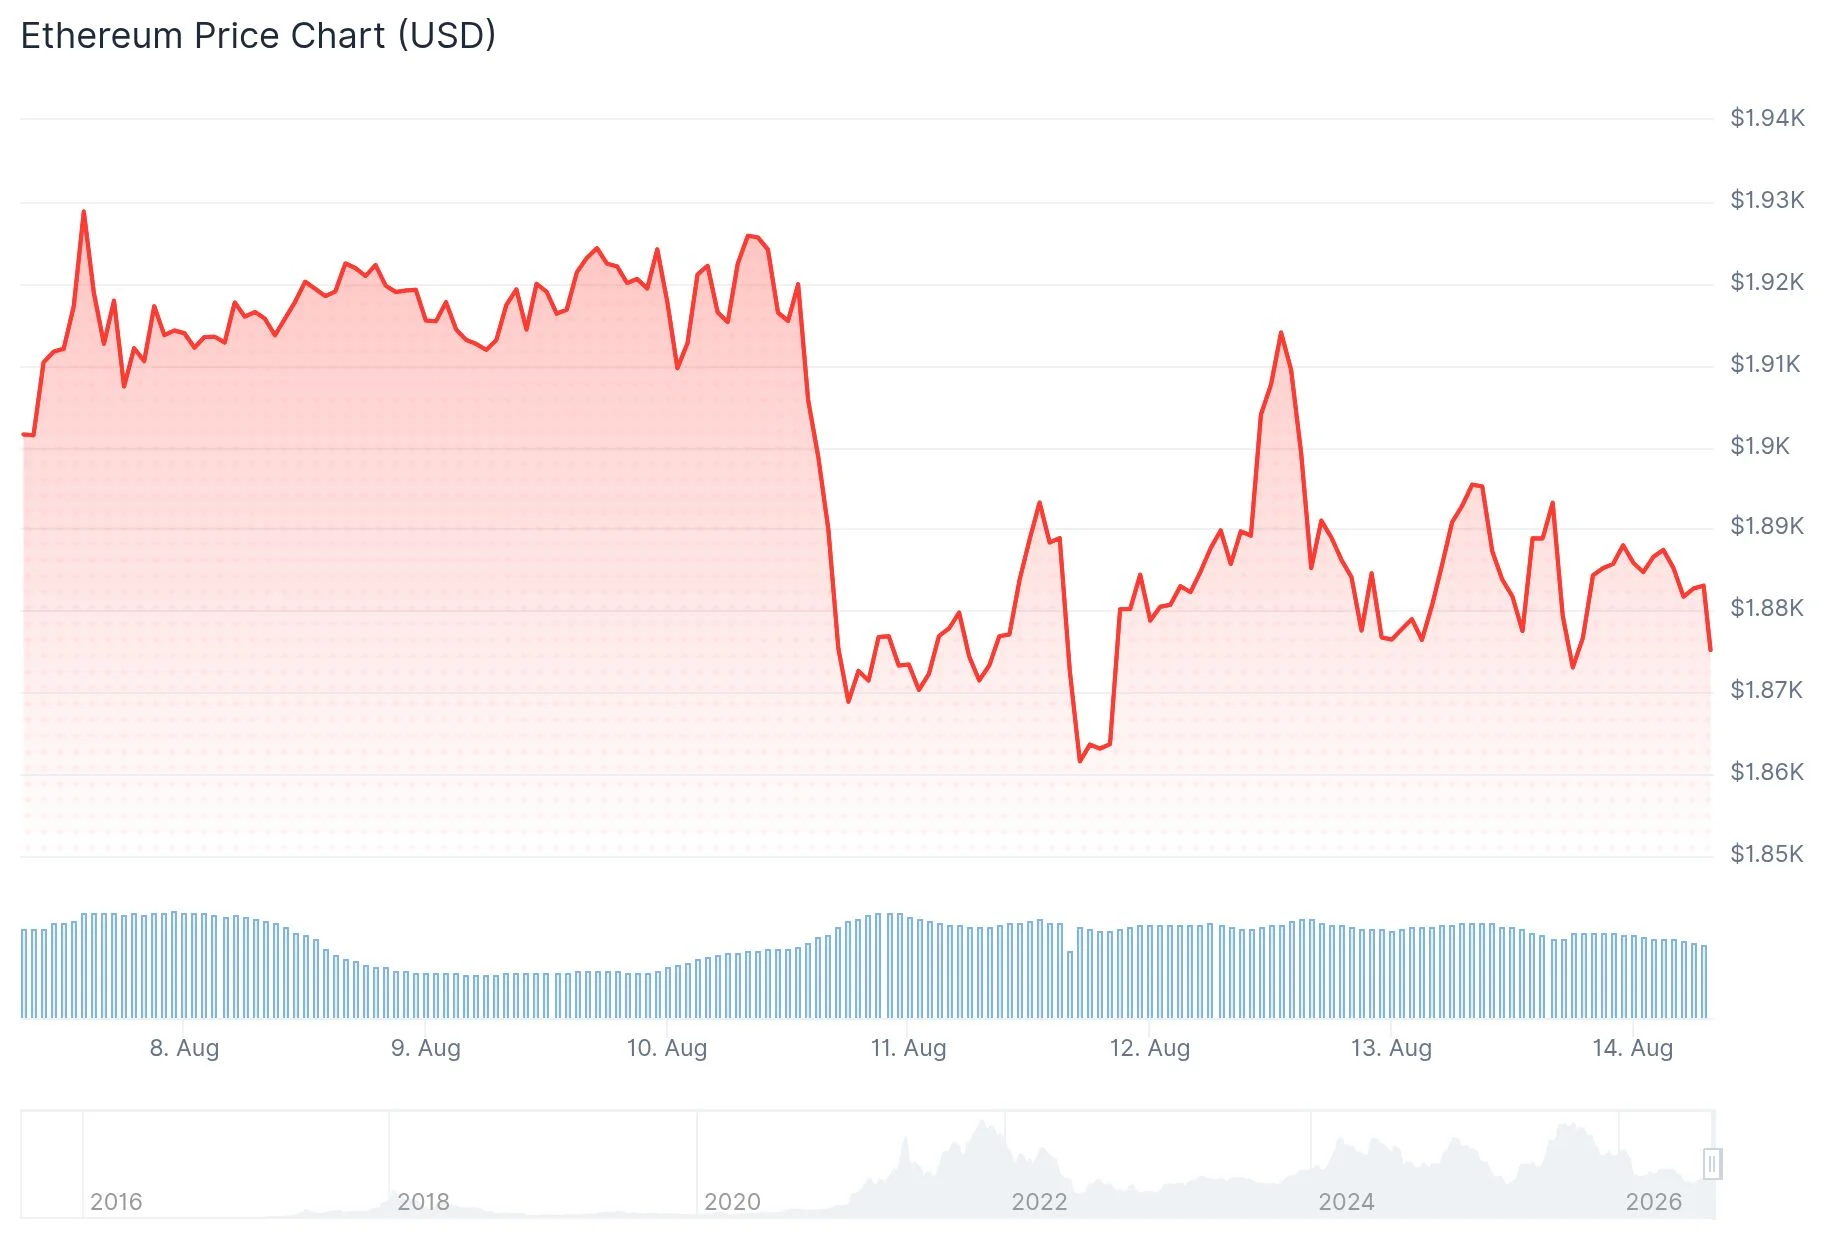
Ethereum experienced a 2.4% decline on August 13, sliding from a session peak of $1,918 down to $1,872. The pullback occurred as market participants took profits following the release of US Consumer Price Index figures, wiping out earlier session advances.
July’s inflation report revealed headline CPI increased 0.1% from the previous month and 3.4% year-over-year. The core measure climbed 0.2% monthly and 2.5% annually. These figures aligned precisely with market forecasts, providing no catalyst for sustained upward momentum.
Prior to the announcement, ETH had rallied to approximately $1,918 before encountering resistance and profit-taking activity. After breaking below the $1,887 threshold, limited order book depth facilitated a rapid descent toward $1,872.
Bitcoin maintained its position around $64,000 following the data release, demonstrating that the inflation figures failed to generate significant directional movement across leading digital assets.
Blockchain Metrics Signal Underlying Weakness
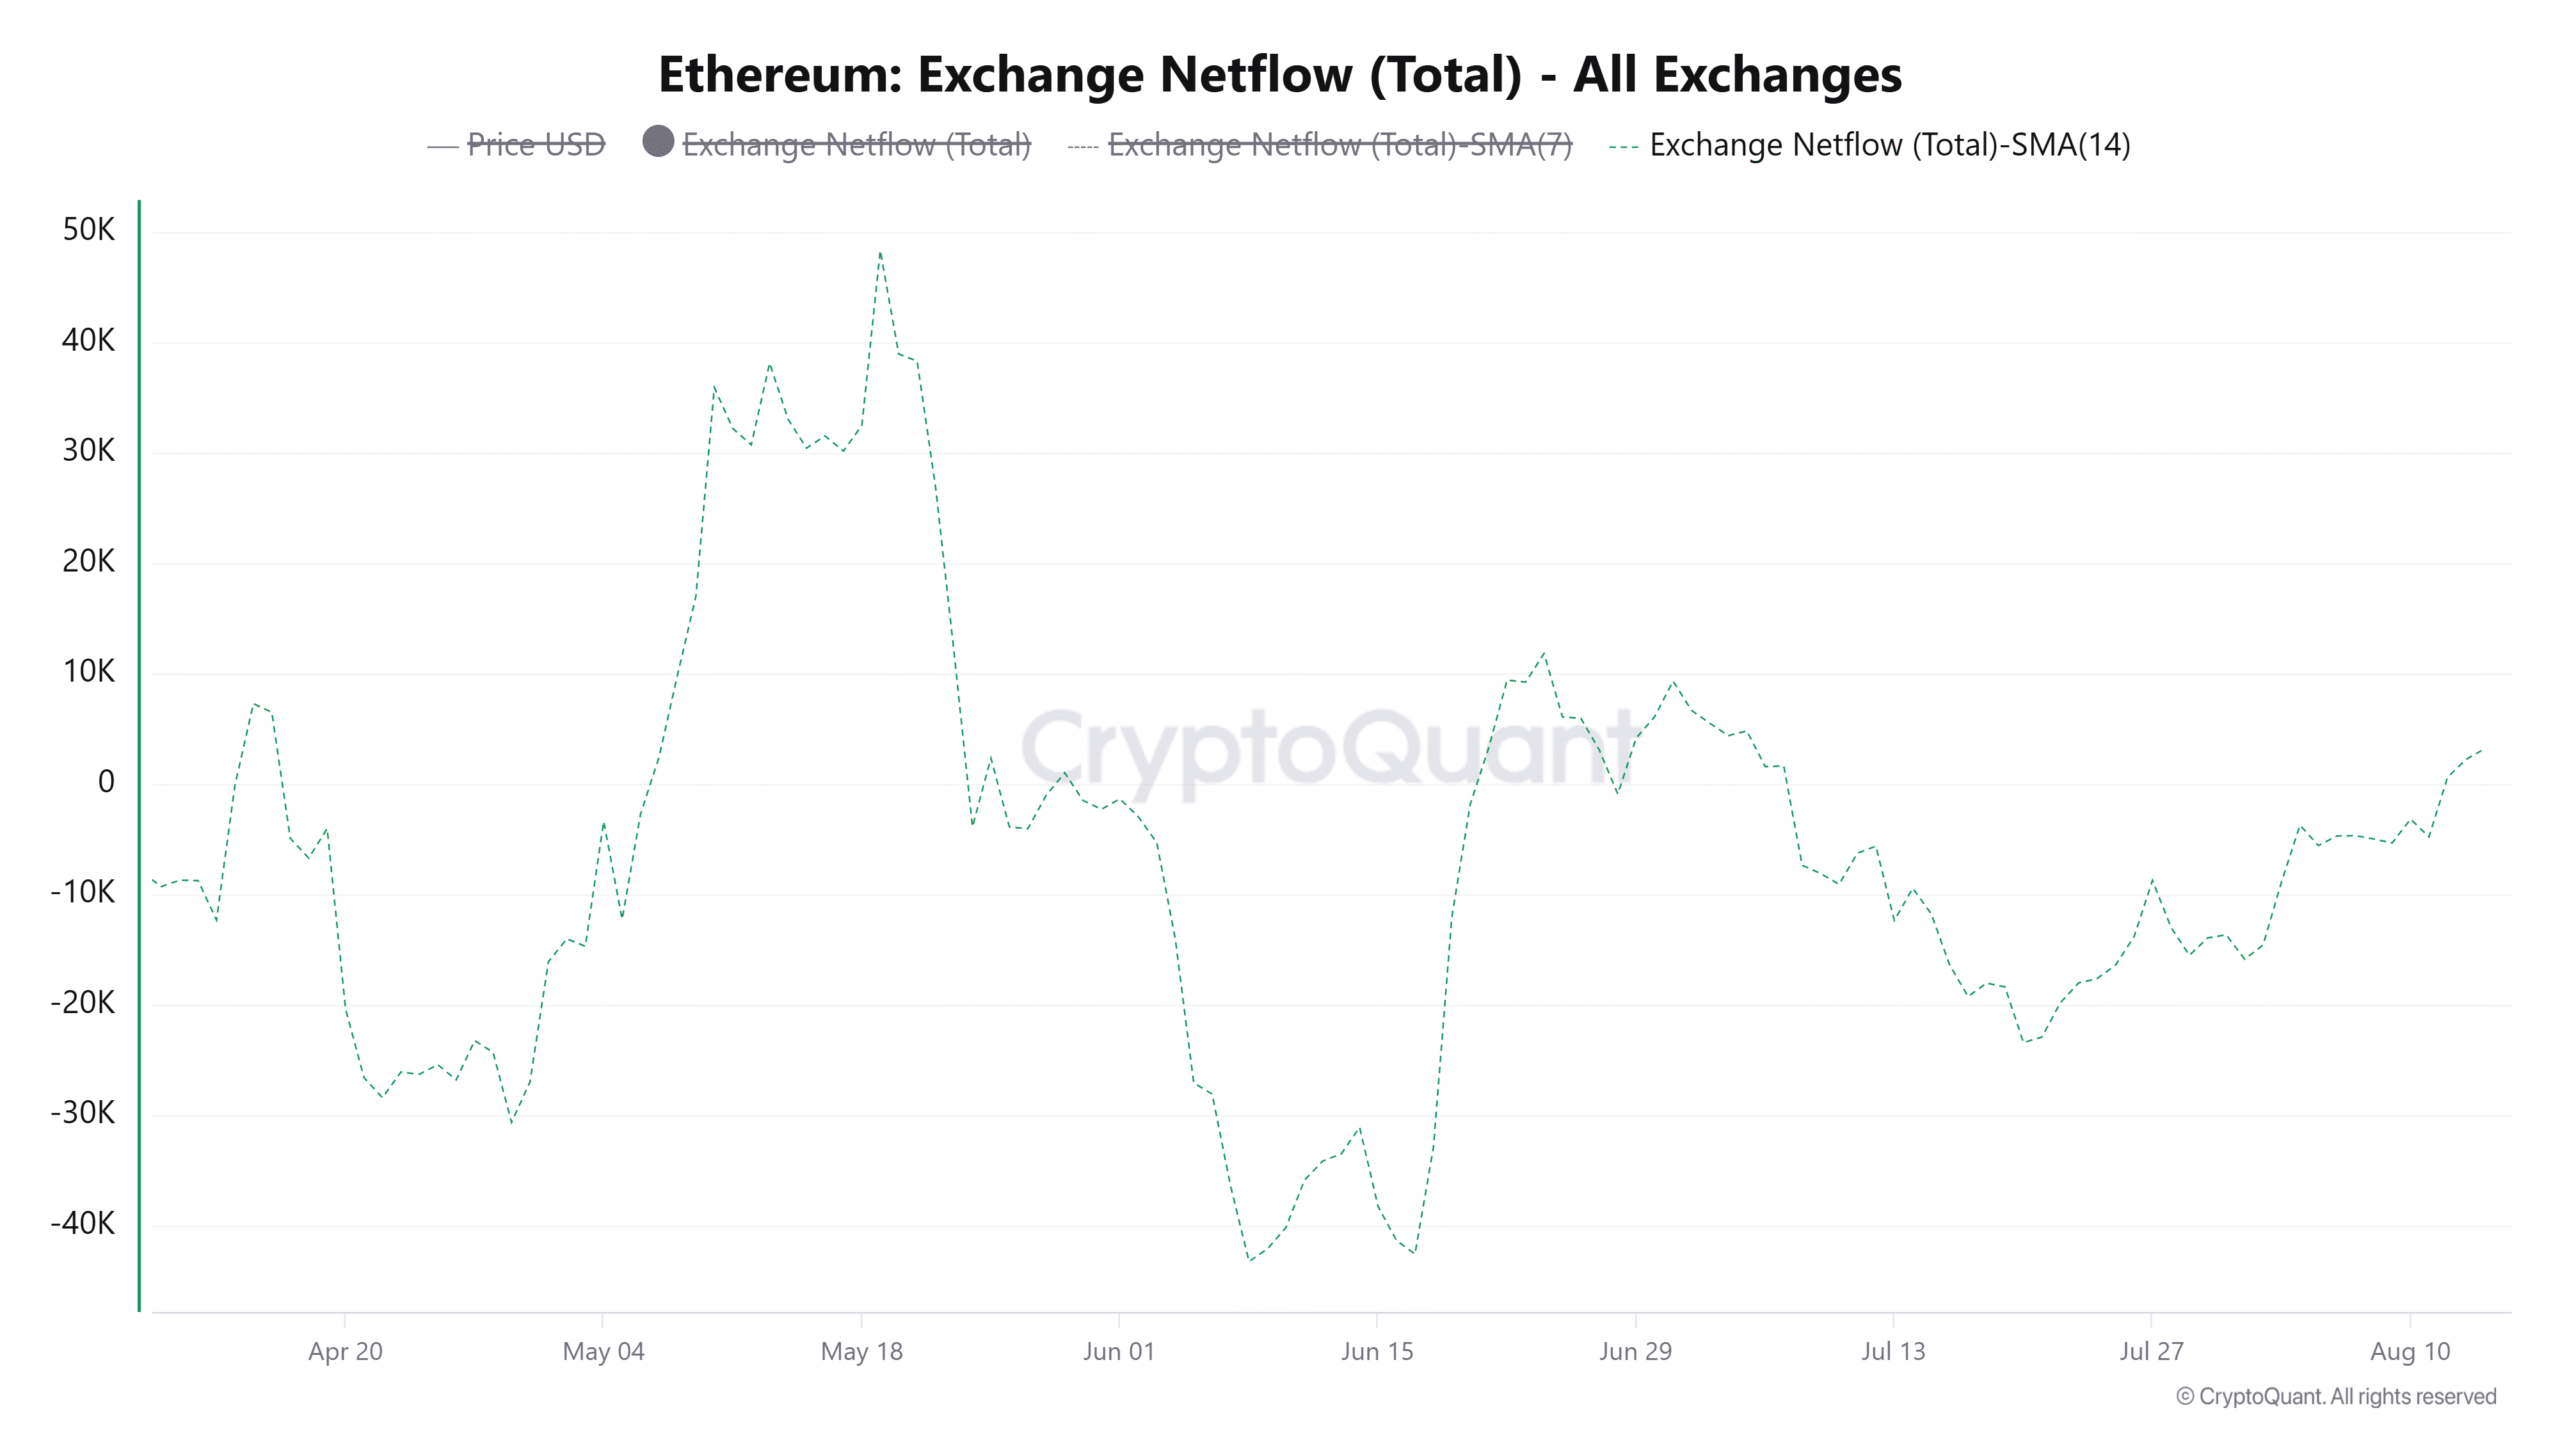
Blockchain analytics revealed concerning trends preceding the price decline. The 14-day moving average of ETH Exchange Netflow turned positive, signaling a slight bias toward distribution activity. Exchange holdings ticked upward to 15.13 million ETH, a pattern that has previously corresponded with heightened selling activity.
The Coinbase Premium Index dropped further to -0.081 despite improving conditions in US equity markets. This divergence suggests American cryptocurrency investors maintain a defensive posture.
Smaller wallet addresses holding between 100 and 10,000 ETH collectively distributed approximately 160K ETH during the past seven days. Conversely, whale addresses containing 10K to 100K ETH demonstrated opposite behavior, accumulating roughly 100K ETH during the identical timeframe.
Spot Ethereum exchange-traded funds in the United States registered $244.9 million in net inflows during the previous week. Through the current week, these products have experienced modest outflows totaling $8.9 million.
Cryptocurrency analyst CryptoGoos highlighted on X that despite ETH establishing a fresh low, distribution from long-term holders has diminished while accumulation has intensified, creating a higher low formation. CryptoGoos characterized this pattern as a bullish divergence signal.
Critical Technical Levels Under Focus
Daily chart analysis reveals Ethereum positioned near the $1,875 Murrey Math support zone. The daily Chaikin Money Flow indicator registered -0.04, marginally favoring distribution. The 4-hour Relative Strength Index measured 45.15, below the 50 midpoint, indicating subdued momentum.
CoinGlass liquidation heatmap data identifies substantial leverage concentration between $1,945 and $1,955 above current trading levels. Downside liquidation clusters appear near $1,850 and $1,835.
Trader Ted Pillows emphasized that ETH must recapture the $1,920 level before any legitimate advance toward $2,000 becomes viable. Analyst Daan Crypto Trades concentrated on the ETH/BTC trading pair, pinpointing 0.03 BTC as the critical threshold required to establish relative outperformance versus Bitcoin.
CryptoQuant analyst MorenoDV observed that ETH’s Net Unrealized Profit/Loss metric on Binance is nearing the -0.35 threshold, a level that has historically coincided with significant market bottoms during late 2019, March 2020, and throughout 2022.
ETH was trading around $1,879 during publication, maintaining position above the 20-day exponential moving average at $1,884 and the 50-day exponential moving average at $1,865.
The post Ethereum (ETH) Whales Accumulate as Retail Investors Exit: Price Analysis appeared first on Blockonomi.
This articles is written by : Nermeen Nabil Khear Abdelmalak
All rights reserved to : USAGOLDMIES . www.usagoldmines.com
You can Enjoy surfing our website categories and read more content in many fields you may like .
Why USAGoldMines ?
USAGoldMines is a comprehensive website offering the latest in financial, crypto, and technical news. With specialized sections for each category, it provides readers with up-to-date market insights, investment trends, and technological advancements, making it a valuable resource for investors and enthusiasts in the fast-paced financial world.