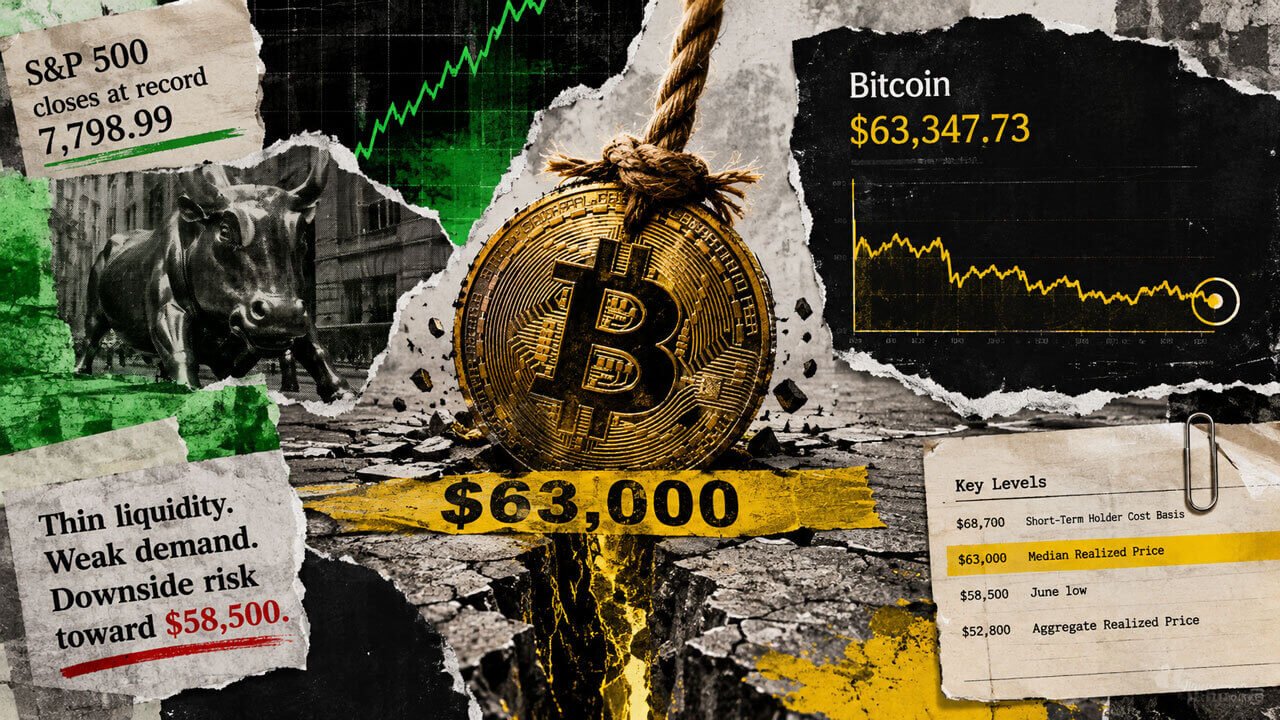
The S&P 500 closed Thursday at a record 7,798.99, while Bitcoin traded at $63,347.73, only a few hundred dollars above an on-chain level that had absorbed every test above it for more than a month.
Sellers appear increasingly exhausted, yet new demand remains too weak to pull price away from support, even on a day when the wider market offered a favorable backdrop.
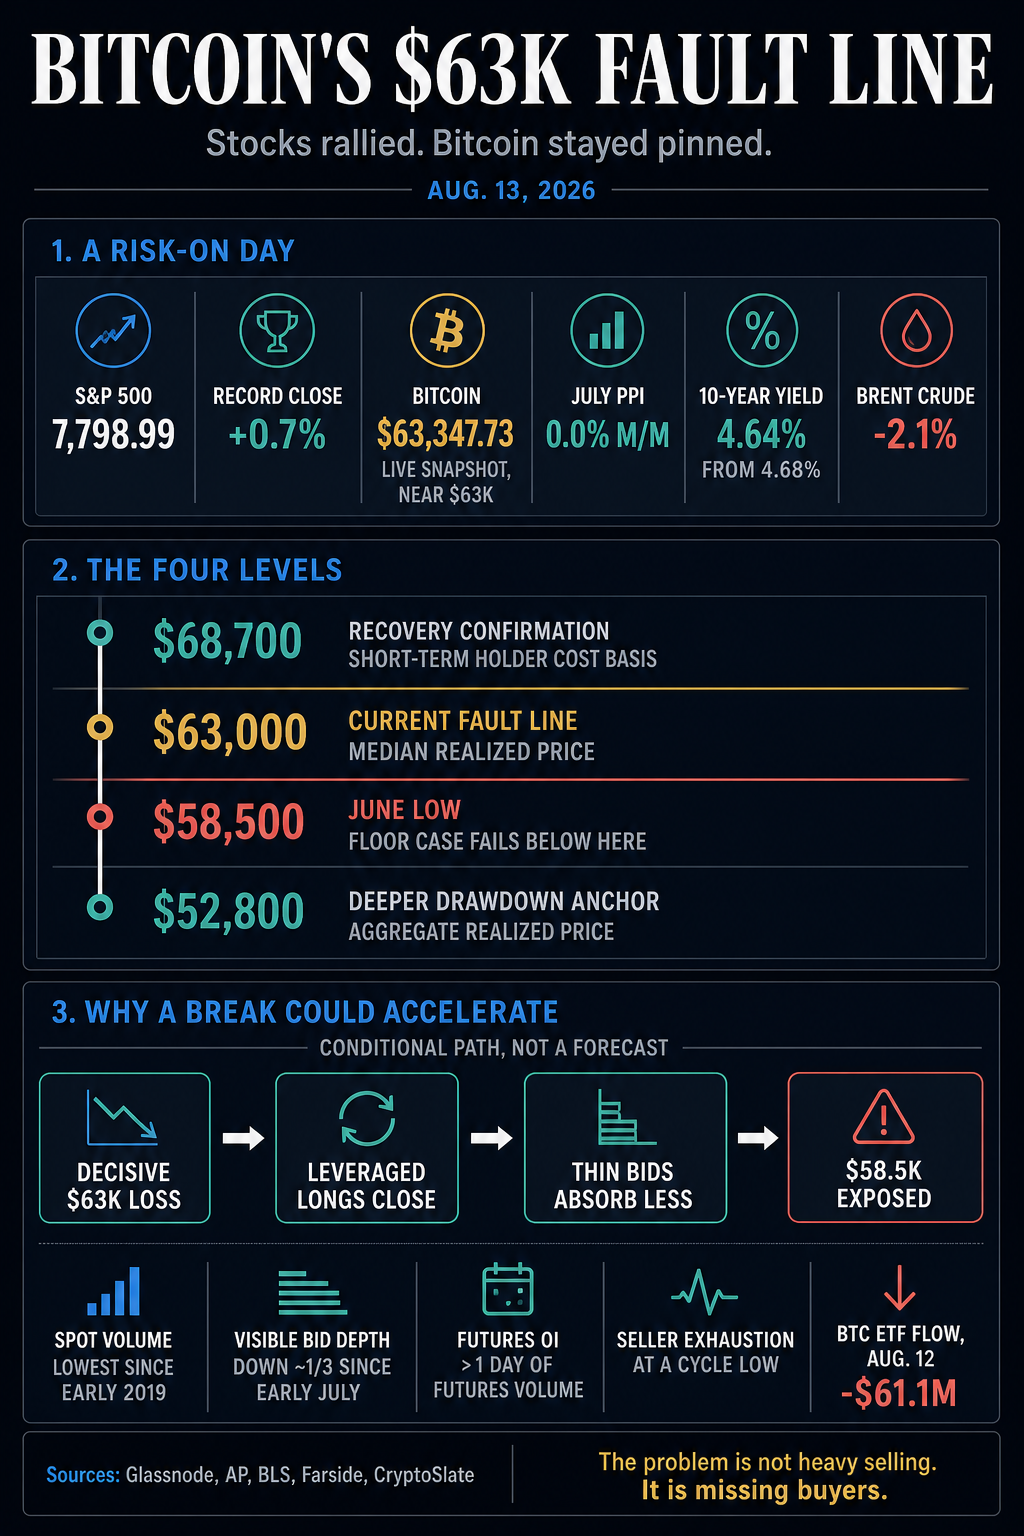
US producer prices were unchanged in July from the prior month, the 10-year Treasury yield eased to 4.64% from 4.68% late Wednesday, and Brent crude fell 2.1%. The inflation details were mixed, with the measure excluding food, energy and trade rising 0.4%, but the headline environment still gave stocks room to reach a new high.
The divergence supports a selective-risk interpretation: investors were willing to own risk while Bitcoin remained pinned near the lower edge of its recent structure. The concurrent strength in stocks and weakness in Bitcoin do not establish that capital moved directly between the two markets.
Why $63,000 is Bitcoin’s fault line
Glassnode’s latest Week On-chain analysis identifies $63,000 as Bitcoin’s Median Realized Price, the price at which half of the circulating supply last moved, making it an approximate midpoint of the market’s cost basis.
Bitcoin had held above that level through repeated tests for more than a month, and repeated visits become more consequential when demand is weak because a former floor can become resistance after a decisive break.
The surrounding levels define the next debate:
| Level | What it represents | What would matter |
|---|---|---|
| $68,700 | Short-Term Holder Cost Basis | A sustained reclaim with rising volume and stronger ETF inflows would confirm improvement. |
| $63,000 | Median Realized Price | A decisive loss could expose the thinner market structure beneath the current range. |
| $58,500 | June low | A break would invalidate the developing floor case and raise overshoot risk. |
| $52,800 | Aggregate Realized Price | A deeper drawdown would approach the broader market’s average acquisition cost. |
These are market-structure markers whose significance depends on price, volume, and ETF-flow confirmation. A move toward $58,500 remains conditional on a decisive loss of $63,000 and subsequent leveraged selling.

Sellers are tiring as risk capital goes elsewhere
Glassnode’s evidence noted that Bitcoin is in a late-stage demand drought, with a Seller Exhaustion Constant at a cycle low, exchange inflows having faded from their early-June peak while remaining positive, and barely half of circulating supply in unrealized profit.
Those conditions can appear when the holders most willing to sell have already reduced their exposure.
Reduced selling pressure has not produced a durable recovery, with recently positive ETF flows remaining a small fraction of the accumulation waves that powered earlier advances.
US spot Bitcoin ETFs recorded $61.1 million in net outflows on Aug. 12, following $7.8 million in inflows the previous day. Bitcoin is struggling to attract the sustained institutional flow needed to move decisively away from support.

That struggle stands out when stocks are setting records while yields and oil are falling. Bitcoin is competing for its share of risk capital, and assets with stronger momentum are currently winning. A macro reversal can revive markets broadly; an asset-specific demand gap needs a Bitcoin catalyst.
ETF inflows could signal either a macro reversal or an asset-specific demand gap, and so could a relatively small wave of spot buying, given unusually thin liquidity. Until either arrives, a favorable macro backdrop may not be enough.
Thin liquidity turns leverage into the deciding risk
Glassnode said spot exchange volume measured in BTC had fallen to its lowest level since the series began in early 2019. The firm also said visible buy-order depth below spot had fallen roughly 33% since early July, leaving less capacity to absorb selling than when Bitcoin last approached its June low.
Futures open interest exceeded one full day of futures trading volume, approaching the record set last September. Glassnode’s Hyperliquid whale cohort had also closed net long every day since mid-March, an unprecedented streak in the cohort’s one-year history.

Together, those conditions create a mechanical downside path. A decisive break below $63,000 could force leveraged longs to close into a market with fewer spot buyers and less visible buy order depth below the price.
That forced selling could quickly expose $58,500 and increase the risk of an overshoot, where thin liquidity can amplify an upside move if demand returns.
Bitcoin would need to reclaim $68,700, the average acquisition price of recent buyers, with stronger volume and more durable ETF inflows to validate recovery. Losing $63,000 could expose the June low, while losing $58,500 would invalidate the developing floor case and leave $52,800, the aggregate Realized Price, as the major valuation anchor in a deeper drawdown.
For now, the S&P 500 record and Bitcoin near $63,000 mean global risk appetite is available, but Bitcoin has yet to win enough of it.
The post Bitcoin’s stall around $63,000 exposes how weak its buyers have become amid record high S&P 500 appeared first on CryptoSlate.
The S&P 500 reached 7,798.99 while Bitcoin hovered above a cost-basis fault line amid record-low spot activity.
The post Bitcoin’s stall around $63,000 exposes how weak its buyers have become amid record high S&P 500 appeared first on CryptoSlate. Analysis, Featured, Macro, Market, Bitcoin, BTC, ETF, ethereum, glassnode, Solana
This articles is written by : Nermeen Nabil Khear Abdelmalak
All rights reserved to : USAGOLDMIES . www.usagoldmines.com
You can Enjoy surfing our website categories and read more content in many fields you may like .
Why USAGoldMines ?
USAGoldMines is a comprehensive website offering the latest in financial, crypto, and technical news. With specialized sections for each category, it provides readers with up-to-date market insights, investment trends, and technological advancements, making it a valuable resource for investors and enthusiasts in the fast-paced financial world.