Key Highlights
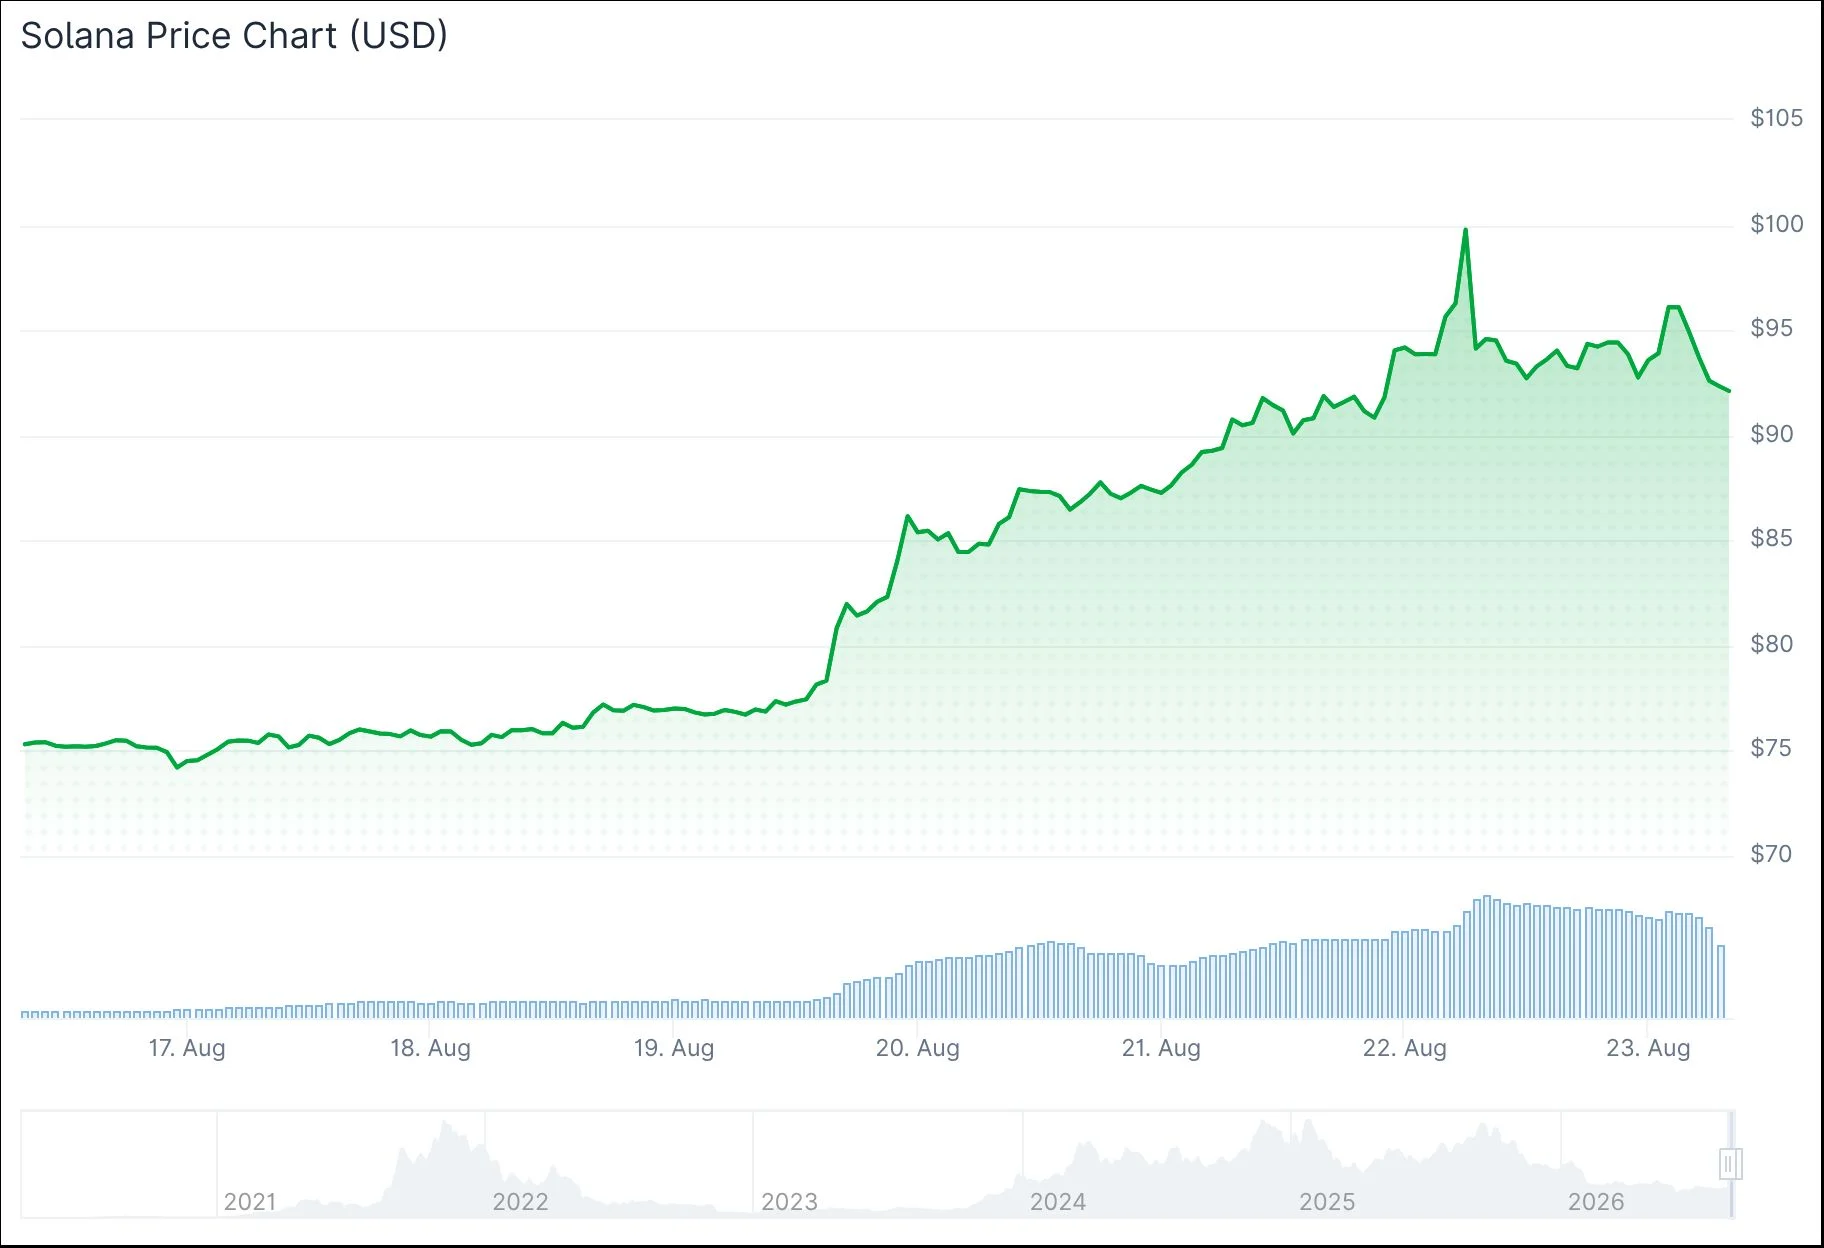
- Solana surged approximately 25% within one week, successfully reaching the $90 milestone following the SEC’s introduction of a fresh cryptocurrency regulatory framework
- More than $4.6 billion worth of short positions faced liquidation across three days, with August 18 marking the 8th most significant single-day liquidation event in cryptocurrency market records
- The Crypto Fear and Greed Index surged from 36 to 76, transforming market sentiment from neutral territory to greedy levels
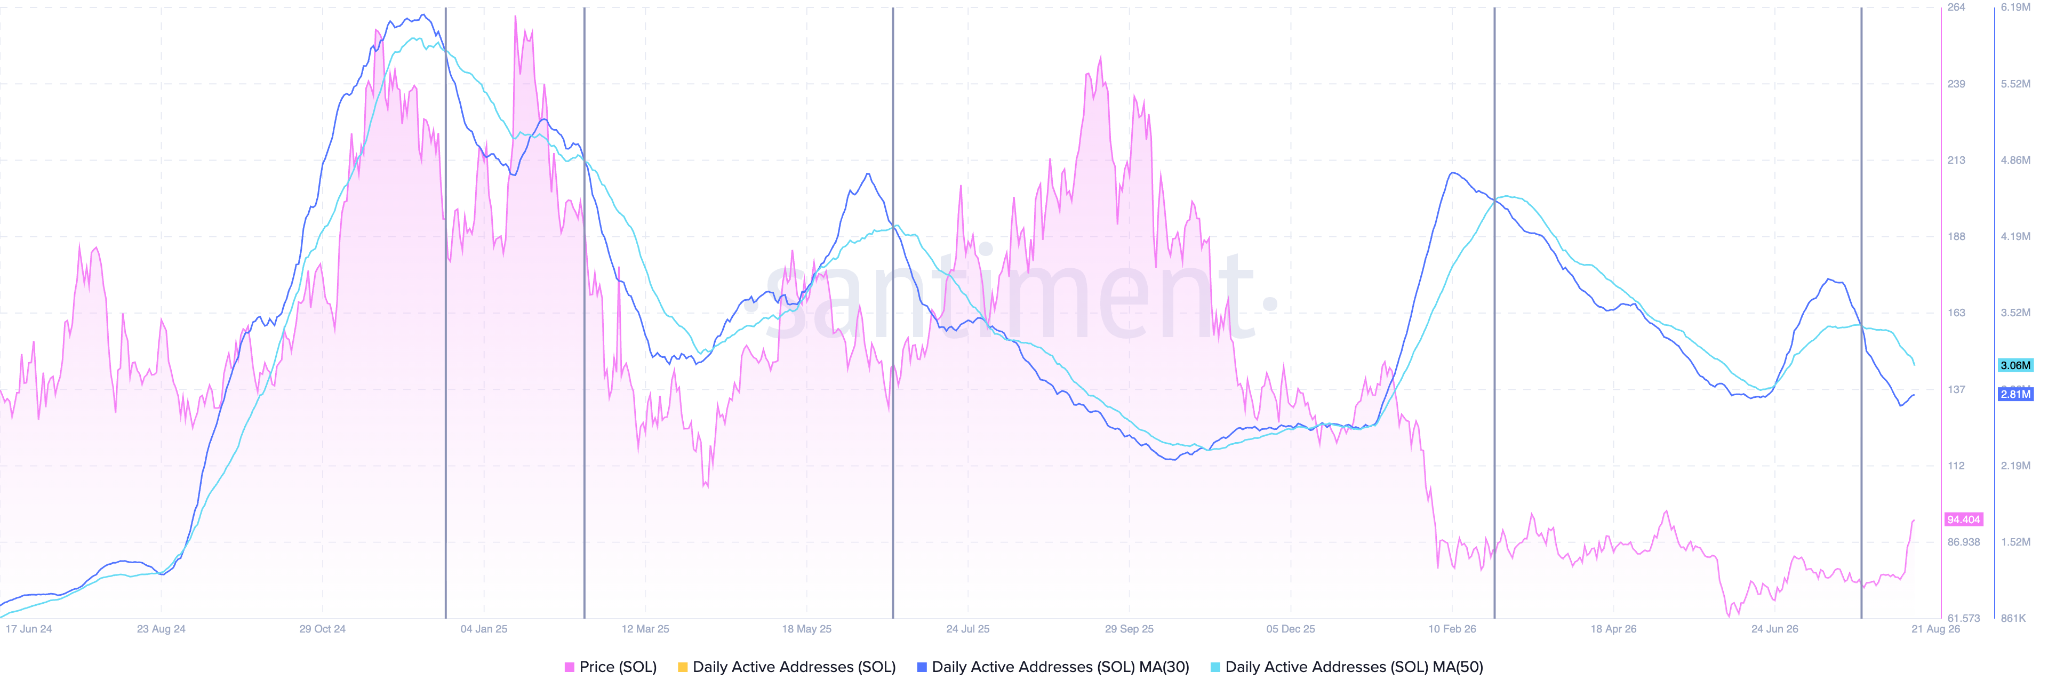
- A critical on-chain indicator — the crossover of 30-day and 50-day moving averages tracking daily active users — previously catalyzed a 70% SOL price increase from $145 to $245
- ETF net inflows climbed to $38 million, marking the strongest performance since May, while market observers monitor $83 as a key support zone for potential retracements
Solana (SOL) has experienced a remarkable surge of approximately 25% throughout the previous seven-day period, successfully breaking through the $90 threshold for the first time in several months. This significant upward movement occurred in the wake of the U.S. Securities and Exchange Commission unveiling a proposed regulatory structure for digital assets.
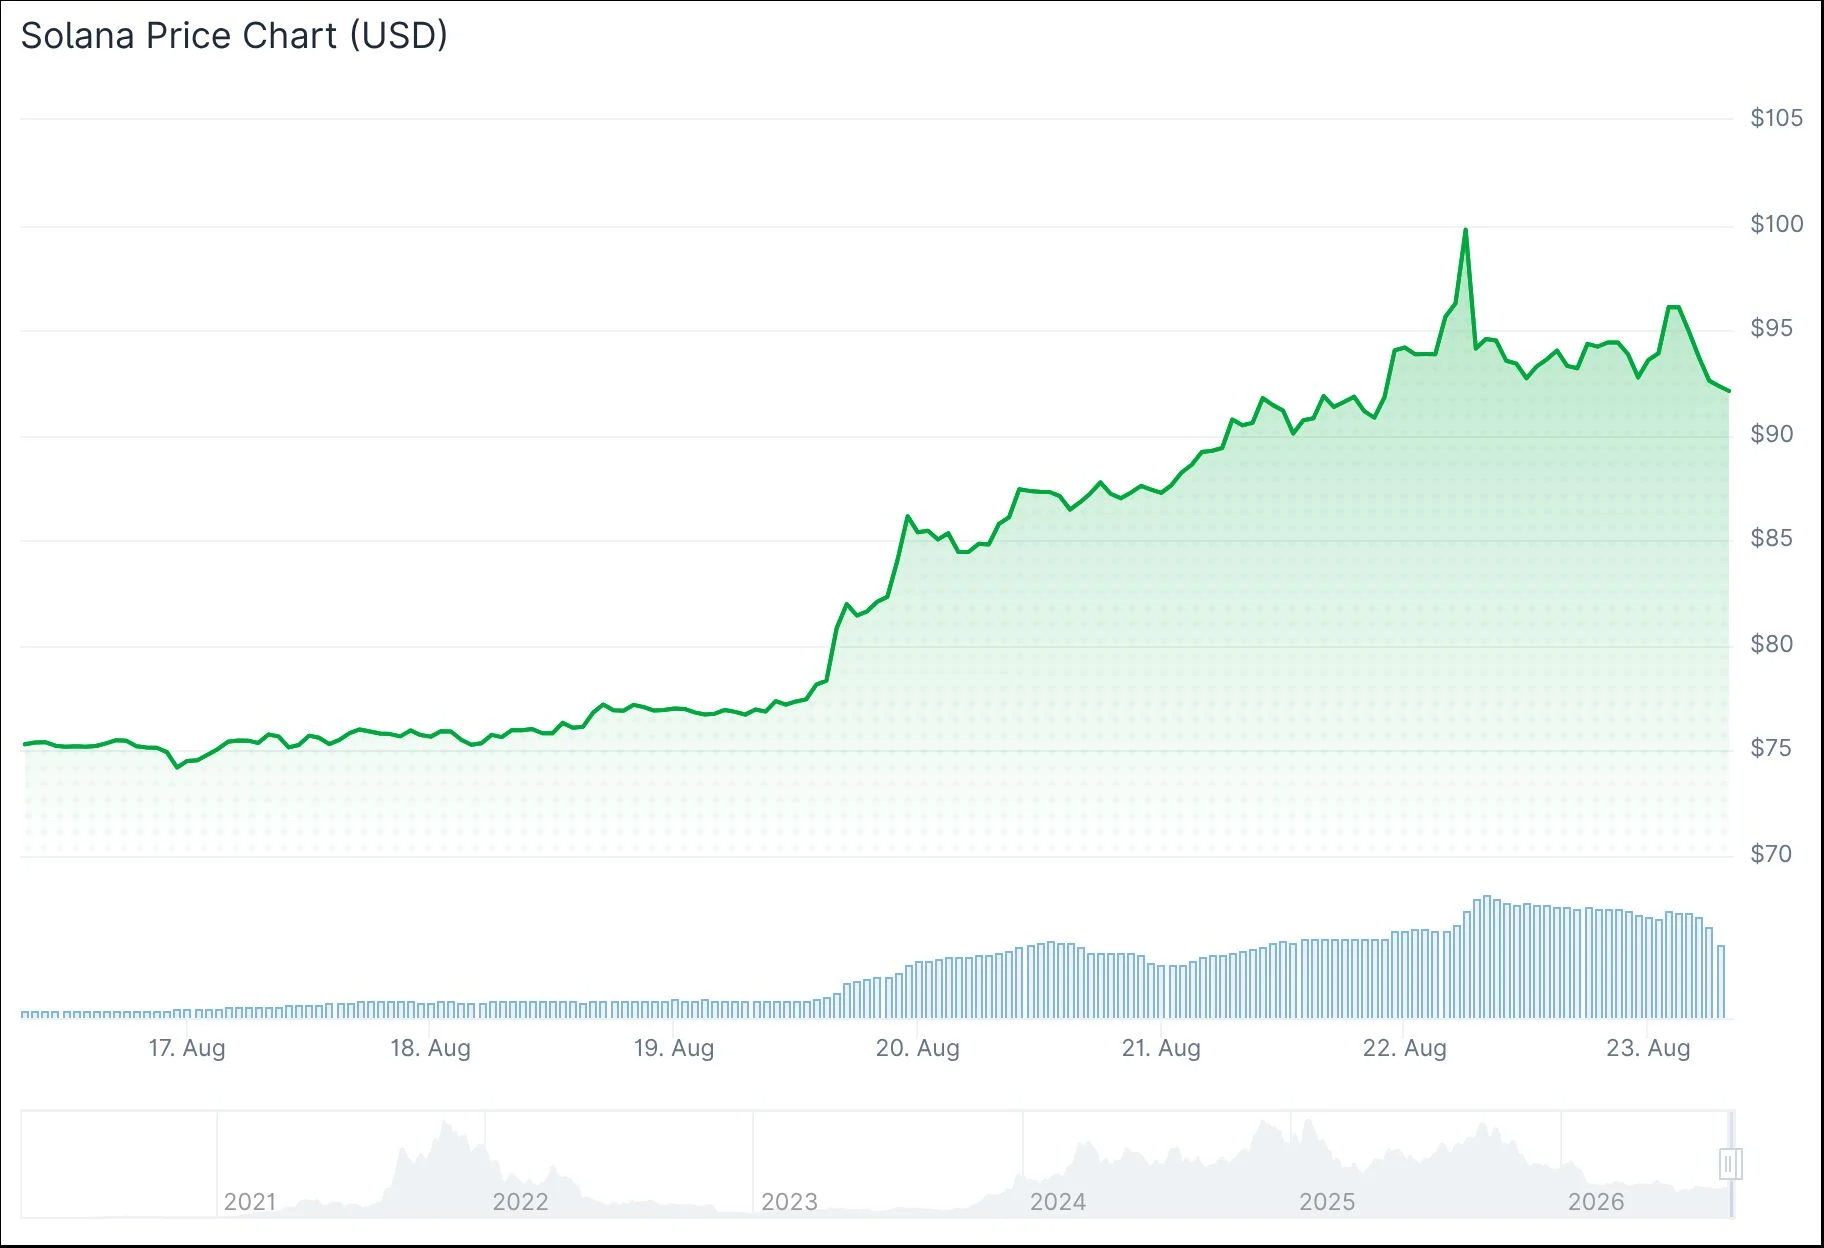
Market activity intensified dramatically, with trading volume jumping nearly 50% to reach $9.5 billion, accounting for approximately 17% of SOL’s total circulating market capitalization. This breakthrough above critical resistance thresholds initiated a domino effect of forced short position closures throughout the cryptocurrency marketplace.
An extraordinary $4.6 billion in bearish positions were eliminated within a span of merely three days. August 18 independently recorded $2.9 billion in liquidations — establishing itself as the 8th most substantial single-day liquidation occurrence in the entire history of cryptocurrency markets.
SOL successfully penetrated both the 200-day exponential moving average (EMA) and two previously established supply zones positioned at $78 and $90. These price levels had served as formidable resistance barriers for an extended period.
On August 21, Solana concluded trading at $93.72, reflecting a daily gain of 6.94%. The Kobeissi Letter, a prominent financial analysis account, highlighted that SOL had climbed above $100 for the first time since February 3rd, characterizing the movement as evidence of accelerating crypto market momentum.
Critical On-Chain Indicator Resurfaces
A significant on-chain metric that historically preceded substantial price rallies has emerged once again. The intersection between 30-day and 50-day moving averages measuring daily active users (DAUs) last occurred in June 2025, following which SOL experienced a dramatic climb from $145 to $245 within several months.
This identical crossover pattern has now reappeared within Santiment’s analytical data tracking Solana’s daily active addresses.
Net inflows into SOL-related ETF products have achieved $38 million — representing the strongest positive measurement recorded since May. This development strengthens the argument that institutional capital is flowing back into the asset.
Market psychology has undergone a dramatic transformation. The Crypto Fear and Greed Index transitioned from approximately 36 (neutral sentiment) to 76 (greedy sentiment) throughout the week.
Technical Levels Under Market Scrutiny
The RSI indicator has advanced into overbought conditions following the sharp price appreciation. A substantial upper wick visible on the current candle indicates mounting selling pressure around present price levels.
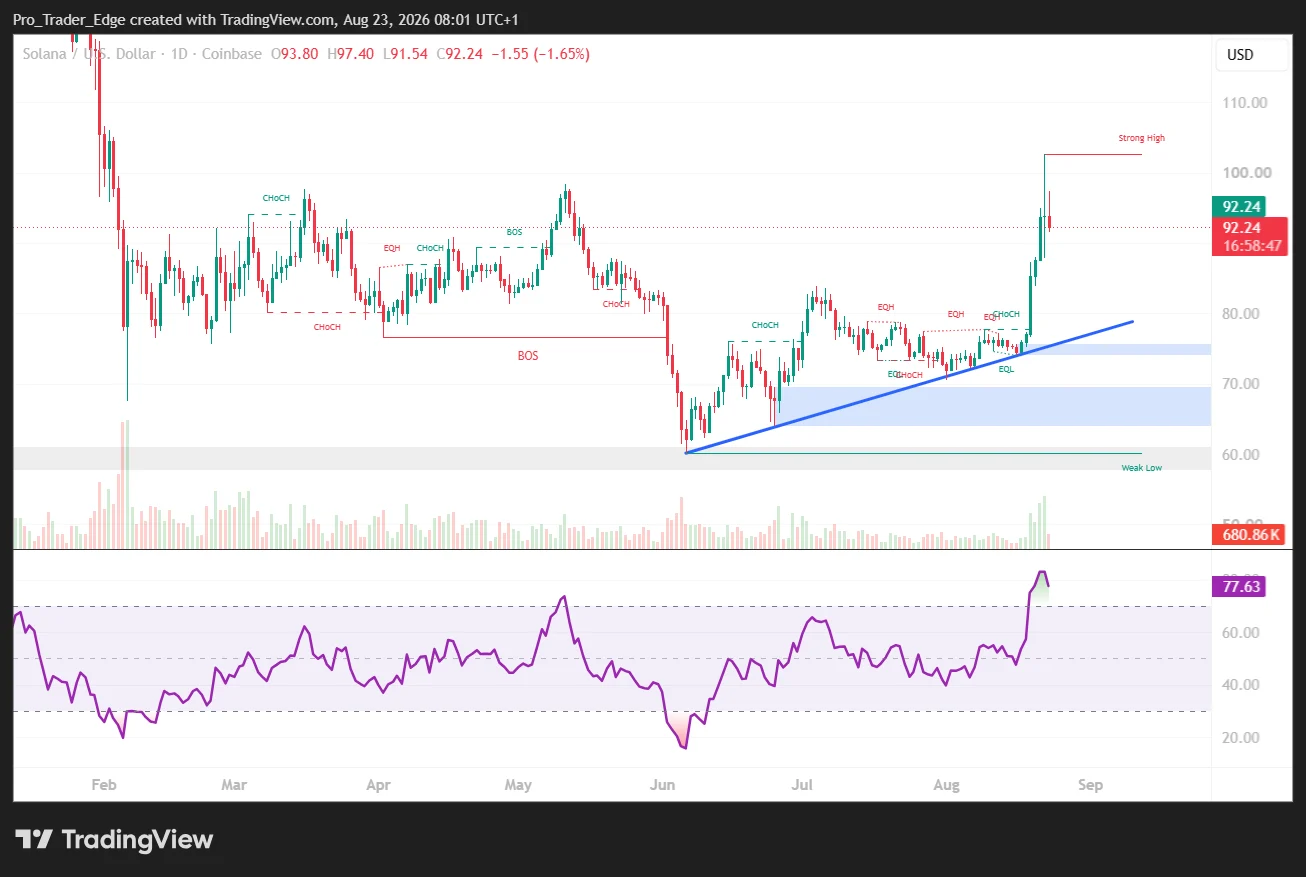
Technical analysts are closely monitoring the $83 price level as a probable retracement target should profit-taking intensify. The 200-day EMA is positioned in close proximity and could function as a support mechanism.
Before this week’s breakout, SOL had challenged the $90 level on at least two separate occasions without successfully maintaining it. Thursday’s closing price above this threshold represents the first decisive settlement beyond $90 throughout this timeframe.
Should Solana maintain its position above $90 during upcoming trading sessions, the subsequent technical target zone emerges around the mid-$120s. A failure to hold this level would preserve the existing pattern of declining peaks.
Current market data indicates SOL trading at $91.89, reflecting a 9.15% daily decline, suggesting initial signs of the anticipated pullback are currently materializing.
The post Solana (SOL) Rallies Past $90 Mark Following Massive Short Squeeze and Bullish On-Chain Signal appeared first on Blockonomi.
This articles is written by : Nermeen Nabil Khear Abdelmalak
All rights reserved to : USAGOLDMIES . www.usagoldmines.com
You can Enjoy surfing our website categories and read more content in many fields you may like .
Why USAGoldMines ?
USAGoldMines is a comprehensive website offering the latest in financial, crypto, and technical news. With specialized sections for each category, it provides readers with up-to-date market insights, investment trends, and technological advancements, making it a valuable resource for investors and enthusiasts in the fast-paced financial world.