
Key takeaways:
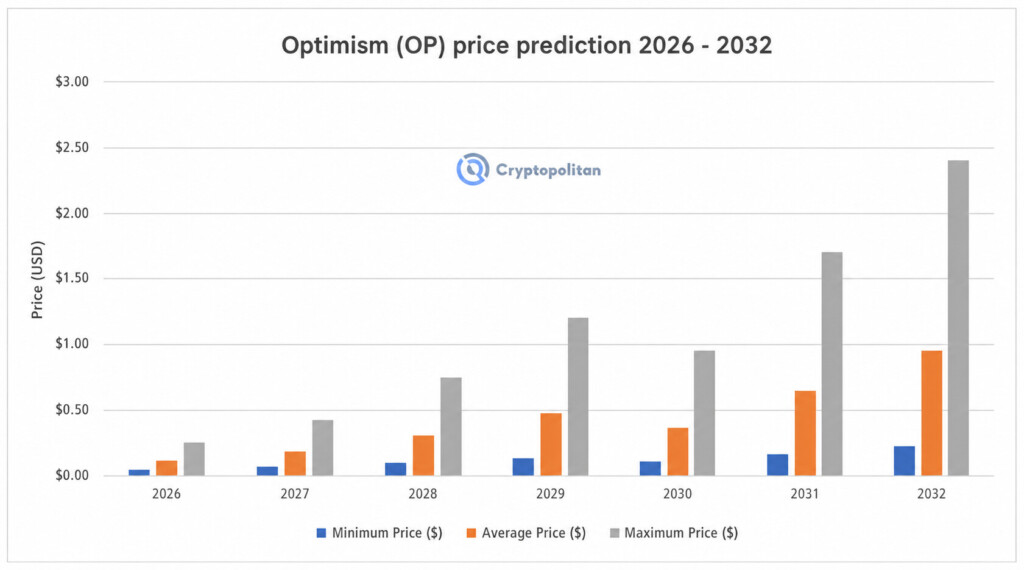
- By the end of 2026, OP is expected to have a minimum and maximum price of about $0.04 and $0.25, respectively.
- Optimism price prediction for 2029 suggests the token could reach a maximum value of $1.20.
- In 2032, OP tokens will range between $0.22 and $2.40, with an average value of $0.95.
Optimism’s (OP) commitment to innovation is highlighted by its support for Layer-3 solutions. These solutions enable the development of decentralized applications (dApps) on top of Layer-2 chains, contributing to the expansive Optimism Superchain.
The platform’s initiatives, including introducing custom gas tokens and Plasma mode aimed at reducing onboarding and operational costs, make it more accessible for new users and developers. As the market closely watches the price movements and growth trajectory of the token, can Optimism reach $10 soon?
Let’s get into the OP price prediction for 2026 – 2032.
Overview
| Cryptocurrency | Optimism |
| Token | OP |
| Price | $0.1228 |
| Market Cap | $285.352M |
| Trading Volume | $66.332M |
| Circulating Supply | 2.3B OP |
| All-time High | $4.85 (Mar 06, 2024) |
| All-time Low | $0.08069 (Aug 18, 2026) |
| 24-hour High | $0.1341 |
| 24-hour Low | $0.1233 |
Optimism price prediction: Technical analysis
| Metric | Value |
| Volatility (30-day Variation) | 5.13% (High) |
| 50-Day SMA | $0.1215 |
| 14-Day RSI | 49.60 (Neutral) |
| Sentiment | Bearish |
| Fear & Greed Index | 63 (Greed) |
| Green Days | 13/30 (53%) |
| 200-Day SMA | $0.1120 |
Optimism price analysis
TL;DR Breakdown:
- Daily momentum remains bearish below $0.1332.
- 4-hour RSI has weakened to 40.60.
- Key support sits at $0.1190–$0.1200.
Optimism 1-day price chart
As of October 22, OP is trading near $0.1233 after its rebound toward $0.135 failed to hold. The price remains below the Bollinger middle band at $0.1332, keeping the daily outlook bearish.
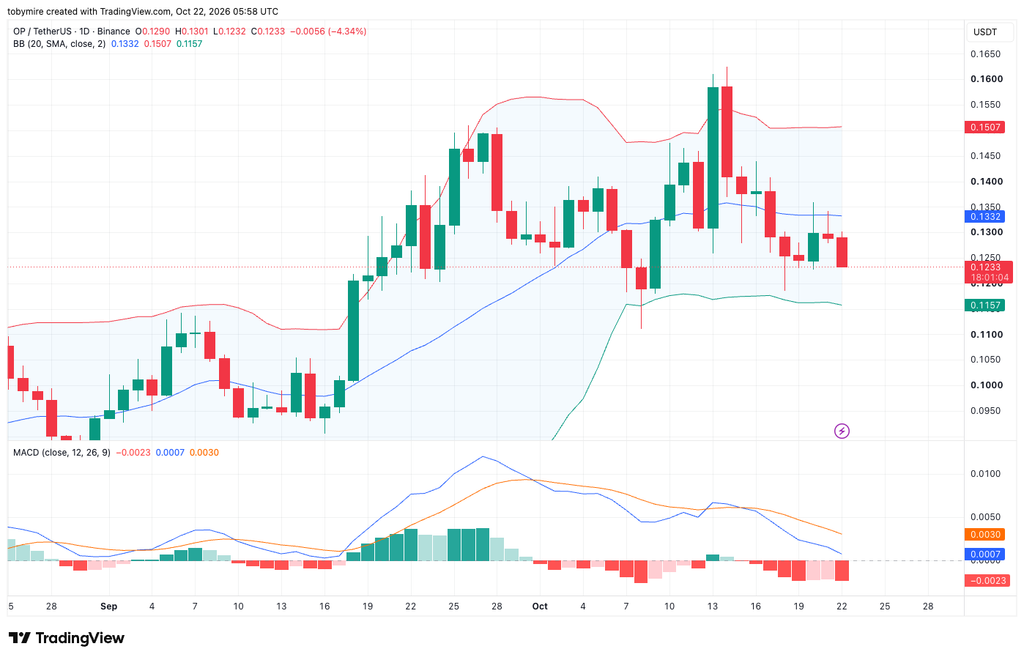
The MACD is at 0.0007, below its signal line at 0.0030, while the negative histogram shows continued selling pressure. Support sits around $0.1200, followed by the lower Bollinger band at $0.1157. Resistance is around $0.1300–$0.1332.
Optimism 4-hour price chart
OP is trading around $0.1235 after giving back its recent recovery toward $0.1330. The price has fallen below all three Alligator lines, clustered between $0.1285 and $0.1292, showing sellers have regained control.
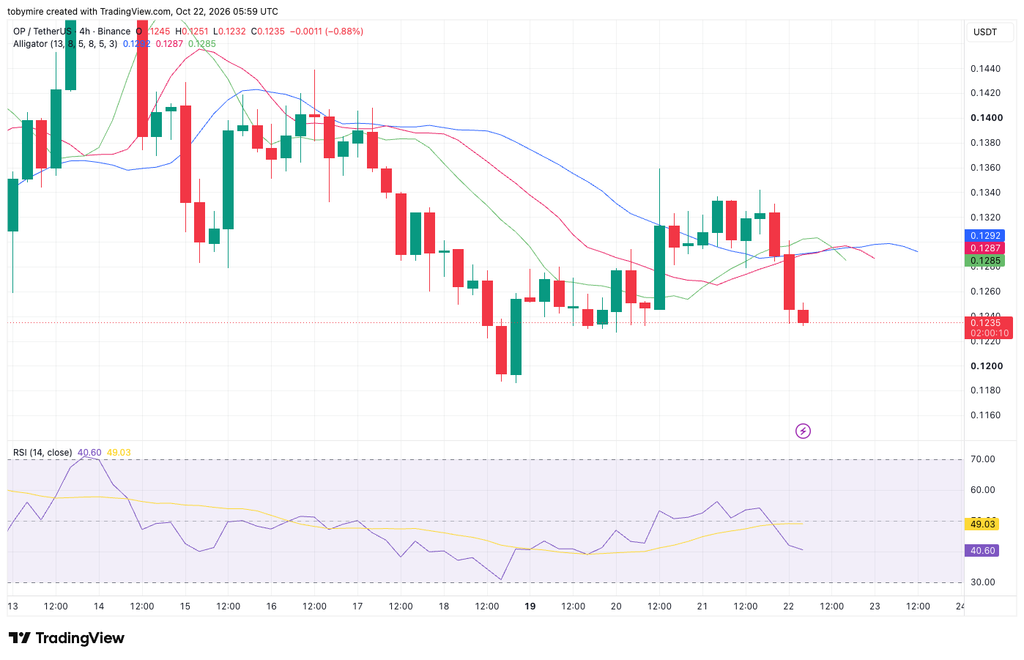
The RSI has dropped to 40.60, below its average of 49.03, confirming weaker momentum without reaching oversold territory. Immediate support lies around $0.1230, followed by $0.1190–$0.1200. The Alligator cluster provides the first resistance area on a rebound.
Optimism technical indicators: Levels and action
Daily simple moving average (SMA)
| Period | Value | Action |
|---|---|---|
| SMA 3 | $ 0.1263 | SELL |
| SMA 5 | $ 0.1291 | SELL |
| SMA 10 | $ 0.1354 | SELL |
| SMA 21 | $ 0.1329 | SELL |
| SMA 50 | $ 0.1215 | BUY |
| SMA 100 | $ 0.1069 | BUY |
| SMA 200 | $ 0.1120 | BUY |
Daily exponential moving average (EMA)
| Period | Value | Action |
|---|---|---|
| EMA 3 | $ 0.1281 | SELL |
| EMA 5 | $ 0.1295 | SELL |
| EMA 10 | $ 0.1318 | SELL |
| EMA 21 | $ 0.1314 | SELL |
| EMA 50 | $ 0.1234 | SELL |
| EMA 100 | $ 0.1173 | BUY |
| EMA 200 | $ 0.1433 | SELL |
What to expect from Optimism?
OP remains under pressure on both timeframes after another failed recovery. Losing $0.1190–$0.1200 would leave $0.1157 as the next daily support, while a sustained recovery above $0.1332 would strengthen the case for improving momentum.
Is Optimism a good crypto investment?
Optimism (OP) could be a good investment if you believe in Ethereum scaling and the growth of Layer 2 solutions. However, like all crypto, it’s risky, and its value depends on adoption and market trends. Only invest what you’re willing to lose!
Will OP recover?
A recovery is possible, but we fear the overall bearish sentiment makes a short-term rebound unlikely. However, as the market consolidates, we expect reduced volatility, which may lead to a breakout in either direction, depending on market dynamics.
Will OP reach $50?
Reaching $50 for Optimism (OP) would be an ambitious target, requiring a significant increase in its price. This level would likely only be achievable in a highly favorable market environment, with substantial advancements in Ethereum adoption, widespread use of Layer 2 solutions, and strong overall market growth.
Will OP reach $100?
Reaching $100 for Optimism (OP) would be extremely ambitious and require unprecedented growth and adoption.
Does Optimism have a good long-term future?
Yes, Optimism shows strong potential for growth and sustained interest, indicating a positive long-term outlook.
Recent news/opinion on Optimism
Unichain schedules move to Optimism’s OP Enterprise
Unichain plans to move its mainnet operations to Optimism’s OP Enterprise on October 29. Optimism will manage its core infrastructure, preparing the network for native asset transfers across OP Stack chains, starting with ETH. blog.uniswap.org
Optimism price prediction October 2026
Optimism’s price prediction for October 2026 suggests a potential low of $0.080, an average of $0.1291, and a high of $0.168.
| Optimism price prediction | Potential Low | Potential Average | Potential High |
| Optimism price prediction October 2026 | $0.080 | $0.1291 | $0.168 |
Optimism price prediction 2026
The price of Optimism is predicted to reach a maximum value of $0.30 in 2026. Traders can anticipate a minimum price of $0.05 and an average trading price of $0.12.
| Optimism price prediction | Potential Low | Potential Average | Potential High |
| Optimism price prediction 2026 | $0.05 | $0.12 | $0.30 |
Optimism price predictions 2027–2032
| Year | Minimum price | Average price | Maximum price |
|---|---|---|---|
| 2027 | $0.06 | $0.18 | $0.42 |
| 2028 | $0.08 | $0.30 | $0.75 |
| 2029 | $0.12 | $0.48 | $1.20 |
| 2030 | $0.09 | $0.36 | $0.95 |
| 2031 | $0.15 | $0.65 | $1.70 |
| 2032 | $0.22 | $0.95 | $2.40 |
Optimism price prediction 2027
In 2027, the Optimism price prediction suggests a maximum price of $0.42, an average trading price of $0.18, and a minimum price of $0.06.
Optimism price prediction 2028
Per the Optimism price forecast for 2028, OP could reach a peak price of $0.75. The average price is projected around $0.30, with a minimum expected at $0.08.
Optimism price prediction 2029
The Optimism price prediction for 2029 suggests a peak value of $1.20. The minimum trading price is expected to be $0.12, while the average market value is projected to be around $0.48.
Optimism price prediction 2030
The Optimism forecast for 2030 suggests a minimum price of $0.09, a maximum price of $0.95, and an average price of $0.36.
Optimism price prediction 2031
According to the Optimism price prediction for 2031, OP could potentially reach a maximum price of $1.70, a minimum price of $0.15, and an average value of around $0.65.
Optimism price prediction 2032
In 2032, the minimum price of Optimism is forecasted to be around $0.22. OP’s value could reach a maximum of $2.40, with an average trading price of $0.95.
Optimism market price prediction: Analysts’ OP price forecast
| Firm | 2026 | 2027 |
| CoinCodex | $0.1251 | $0.1154 |
| Priceprediction.net | $0.292 | $0.3194 |
Cryptopolitan’s Optimism (OP) price prediction
Cryptopolitan’s overall price prediction for Optimism (OP) suggests a conservative outlook for the cryptocurrency in the near term. For 2026, the maximum forecast price is between $0.07 and $0.2. Over the next few years, Optimism is projected to appreciate substantially, with prices anticipated to rise from a minimum of $1 to a maximum of $3 by 2032.
Optimism historic price sentiment
- Optimism (OP) launched at $4.57 in May 2022 but quickly fell following the UST de-pegging and LUNA collapse, ending June at $0.54 and later dropping below $0.42. It briefly recovered above $1.90 in August before retreating after the FTX collapse.
- In 2023, OP rallied above $3.00 before correcting sharply, eventually closing the year near $3.90. The token reached its all-time high of $4.85 in March 2024 but weakened throughout the year, ending December between $1.61 and $2.77.
- In 2025, OP remained under pressure, falling from a January high of $2.18 and spending most of the year below $1.00, closing December between $0.31 and $0.33.
- In 2026, OP traded between $0.22 and $0.37 in January, $0.11 and $0.20 in February, and $0.10 to $0.14 in March. It averaged around $0.11 in April and traded between $0.122 and $0.136 in May.
- In June, OP ranged between approximately $0.09 and $0.11. In July, the token traded between roughly $0.083 and $0.109, averaging around $0.097 for the month.
- In August, OP traded between roughly $0.080 and $0.118, briefly breaking above $0.10 before retreating and ending the month near $0.087.
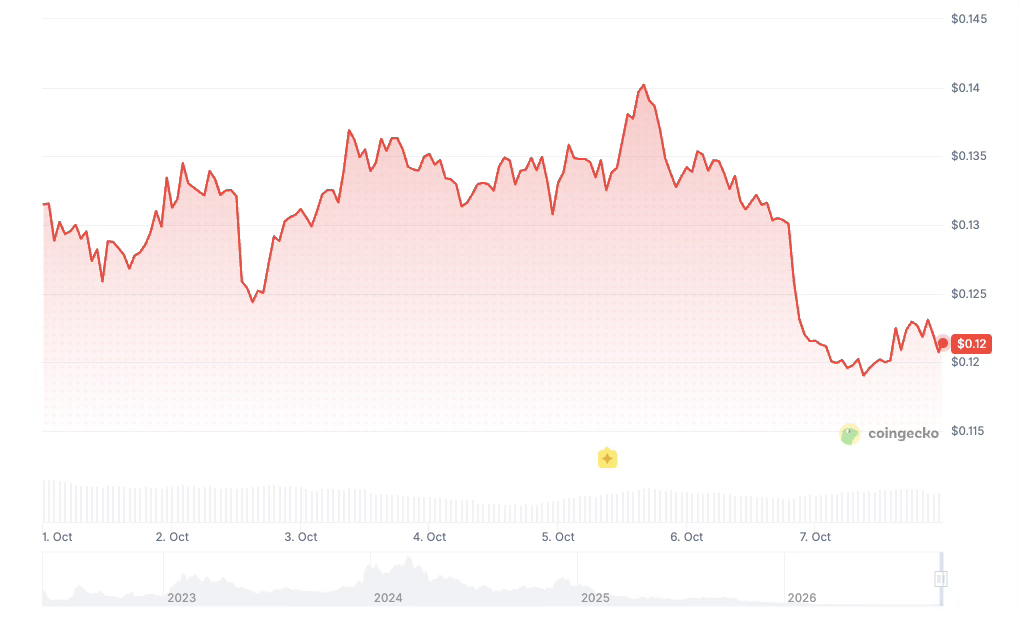
- In September, OP recorded a low of $0.0908 and a high of $0.1503, with an average daily closing price of $0.1138. As of October 21, OP is trading around $0.1245, up 2.6% from October 8 but still 3.9% below September’s closing price of $0.1295.
This articles is written by : Nermeen Nabil Khear Abdelmalak
All rights reserved to : USAGOLDMIES . www.usagoldmines.com
You can Enjoy surfing our website categories and read more content in many fields you may like .
Why USAGoldMines ?
USAGoldMines is a comprehensive website offering the latest in financial, crypto, and technical news. With specialized sections for each category, it provides readers with up-to-date market insights, investment trends, and technological advancements, making it a valuable resource for investors and enthusiasts in the fast-paced financial world.