TLDR:
- ETH fell 5.60% in 24 hours to $2,558.66, and CoinGecko data also shows a 5.86% loss over the past 7 days.
- Ali Charts sees $2,540 and $2,500 as ETH’s next visible downside levels after it broke below its channel.
- SOL must lose $114 decisively before the $110 target carries real technical weight, per Ali Charts’ view.
- Reclaiming $120 would weaken the bearish SOL setup, while RSI lower highs show buyers are losing control.
The Ethereum price fell 5.60% in 24 hours to $2,558.66, according to CoinGecko. Over seven days, ETH has lost 5.86%. Daily trading volume stands at about $18.76 billion.
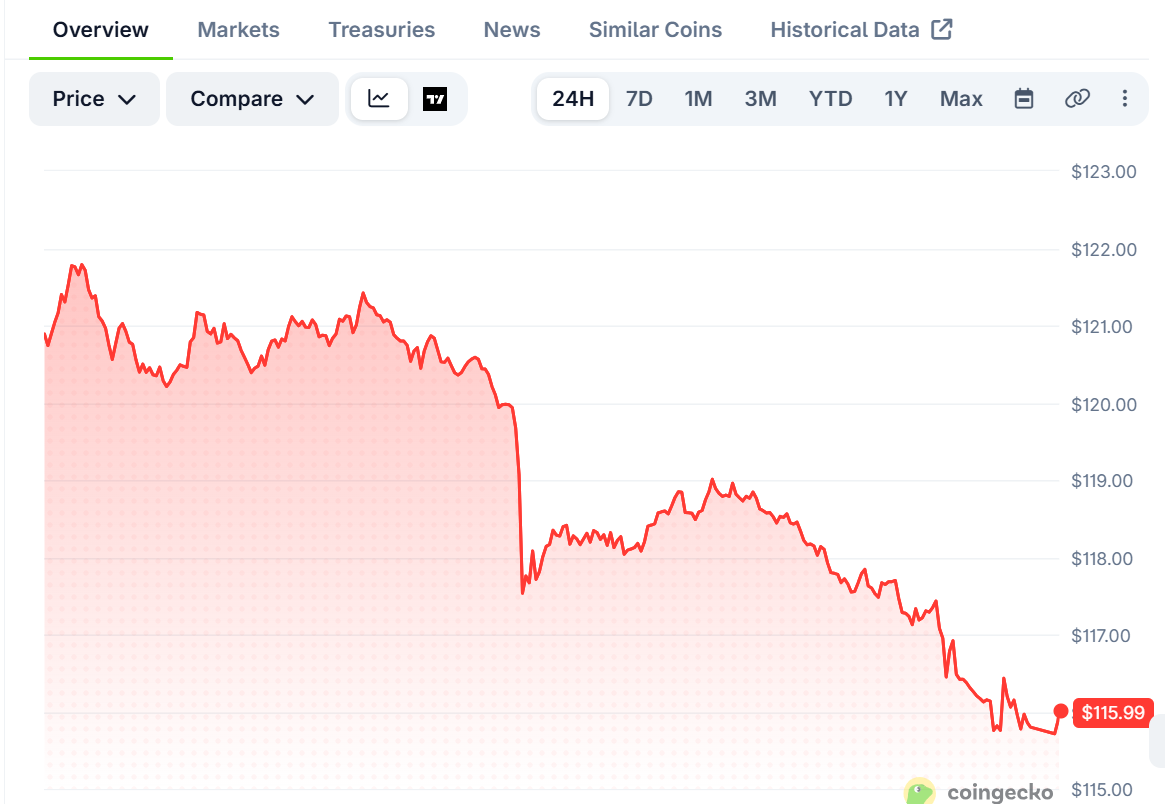
Solana trades at $115.85 on CoinGecko, down 4.14% on the day and 4.66% on the week. Analysts now ask whether ETH is leading the drop while SOL simply trails it.
Ethereum Price Breaks Below Channel Support
Market analyst Ali Charts says ETH broke below its range channel first.
The chart shows ETH near $2,574, with $2,540 and $2,500 as the next visible downside levels. A move to $2,500 would keep pressure on the broader altcoin market.
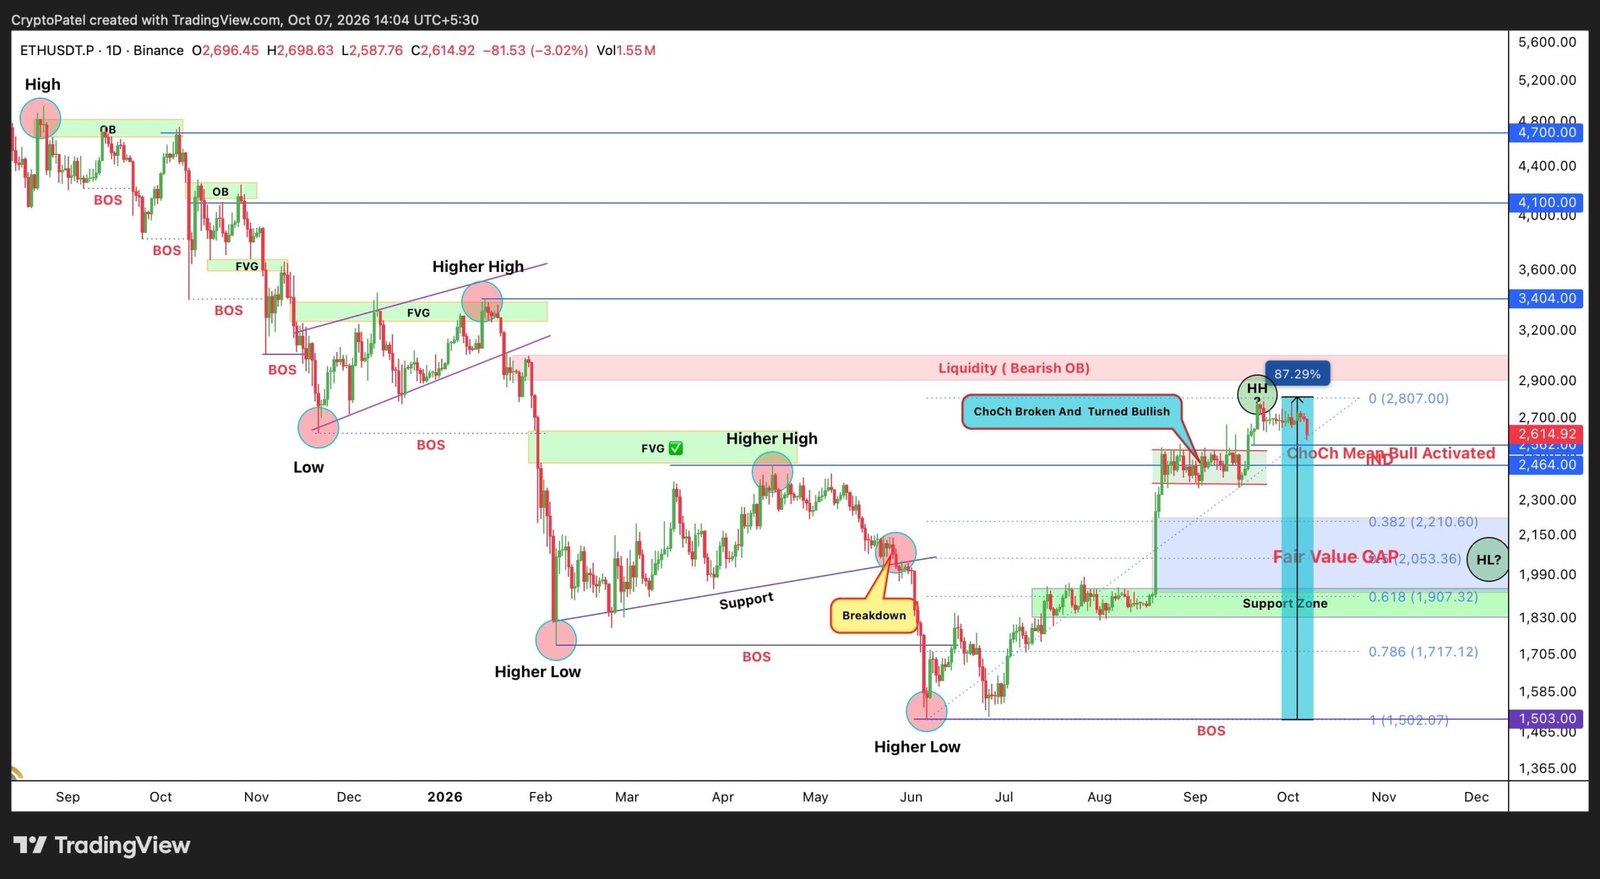
Trader Crypto Patel flags $2,562 as a key decision zone. A daily close below that level would shift focus to the next higher low. Patel does not plan to chase price at that point.
The trader’s accumulation zone sits between $2,053 and $1,868. Several signals overlap there: the 0.5 to 0.618 Fibonacci retracement, a fair value gap, and a bullish order block.
A fair value gap marks an area where price moved too fast for orders to fill. An order block marks where large buyers previously stepped in.
Patel would treat that zone as a long-term accumulation area only after a bullish market structure shift confirms it. Price must show buyers returning first.
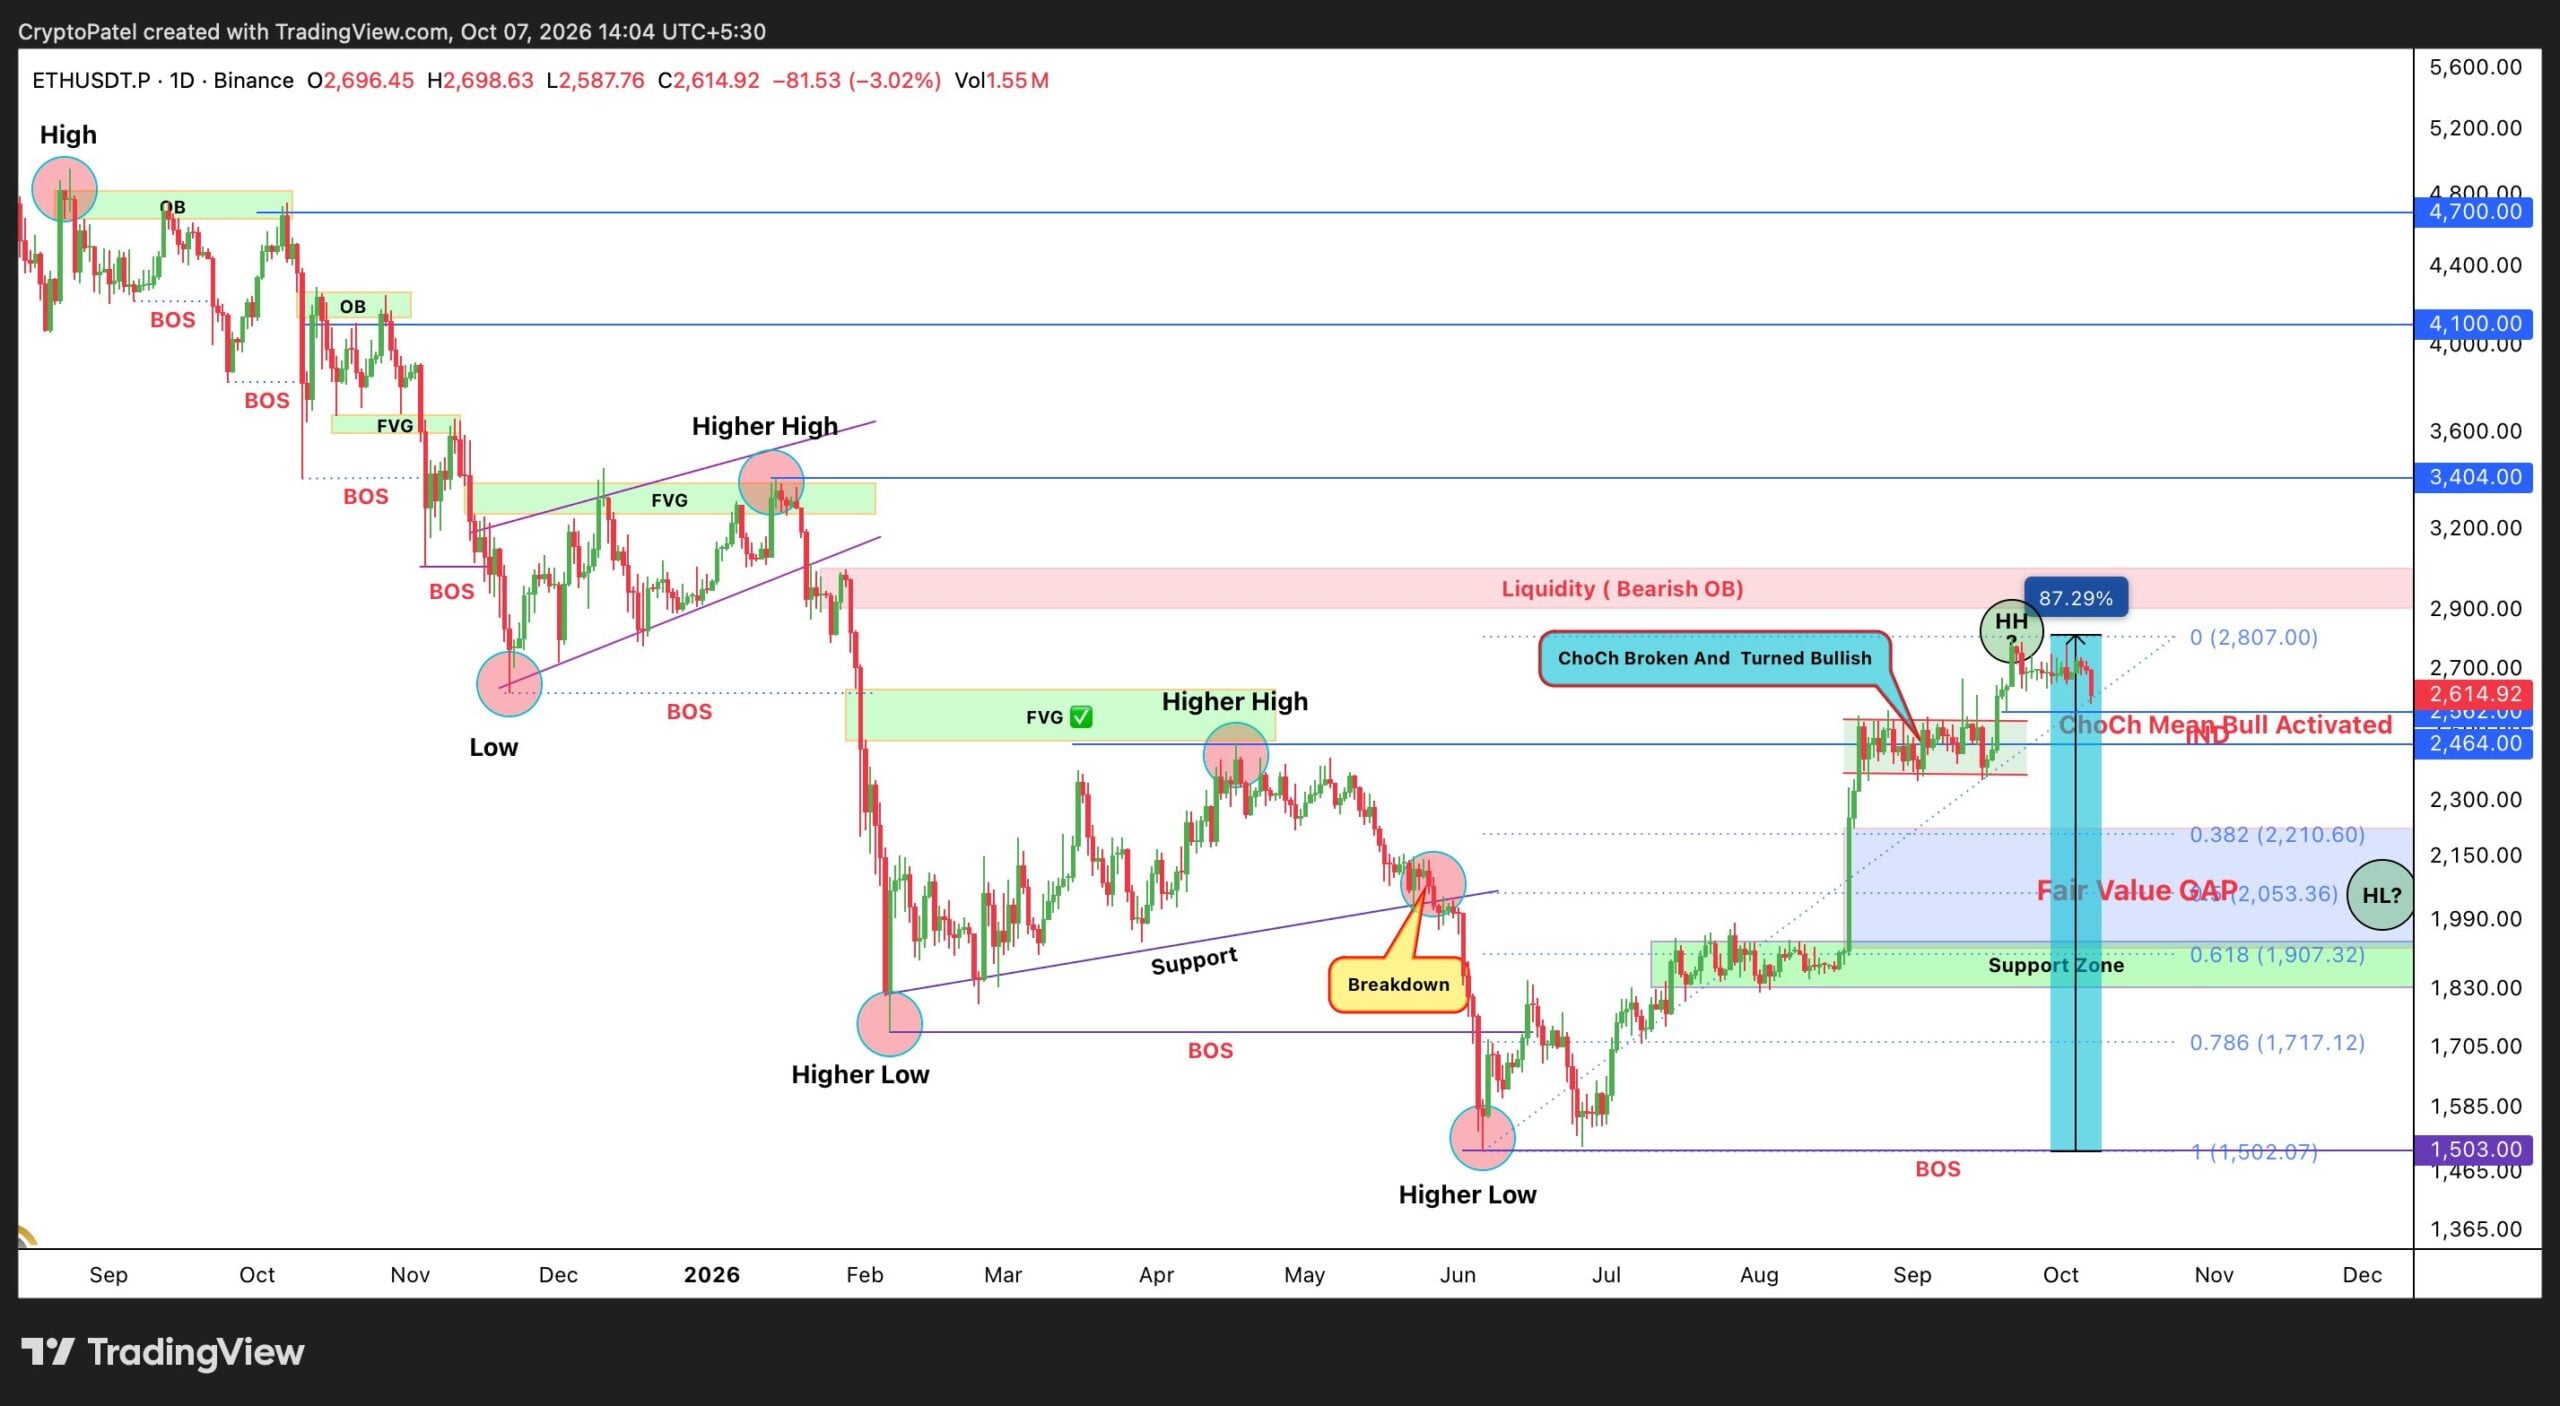
Patel also watches the 0.786 Fibonacci level near $1,717 for a sharp liquidity sweep. Long-term targets of $5,000 and $10,000 remain the trader’s view, not a forecast the current data supports.
Will Solana Follow the Ethereum Price Lower?
Ali Charts shows Solana near $117.25 after losing the $120 area. The first downside target is $114, followed by $110 if selling accelerates. SOL would need to lose $114 decisively to give the $110 target real weight.
The setup has an exit for bulls. Reclaiming $120 would weaken the bearish case, according to the same chart analysis.
Trader Wealthmanager sees a similar picture on the four-hour timeframe. SOL holds the lower end of its range near $117.70. The Binance chart shows a descending trendline from recent highs.
RSI, a gauge of buying momentum, keeps forming lower highs while price stays flat. That pattern suggests buyers are losing strength. Wealthmanager says a decisive range break will confirm the next move.
The relative setup matters here. ETH has already made the sharper breakdown, while SOL still holds above its key $114 support. That gap leaves room for SOL to lag ETH and then fall harder if ETH keeps sliding.
Solana’s 24-hour volume of $3.10 billion shows active trading around these levels.
CoinGecko now shows SOL at $115.85, already below the levels both analysts cited. It still sits above the $114 support.
ETH’s reaction around $2,562 and $2,500 may set the tone for SOL. A clean loss of $114 would put $110 in play. These remain analyst views, not guarantees.
The post Ethereum Price Slides Toward $2,500, and Solana Could Be Next appeared first on Blockonomi.
This articles is written by : Nermeen Nabil Khear Abdelmalak
All rights reserved to : USAGOLDMIES . www.usagoldmines.com
You can Enjoy surfing our website categories and read more content in many fields you may like .
Why USAGoldMines ?
USAGoldMines is a comprehensive website offering the latest in financial, crypto, and technical news. With specialized sections for each category, it provides readers with up-to-date market insights, investment trends, and technological advancements, making it a valuable resource for investors and enthusiasts in the fast-paced financial world.