TLDR
- Crypto analyst Ali Martinez identifies an ascending triangle formation on XRP’s monthly timeframe, with a critical resistance zone around $3.66.
- Should XRP successfully breach $3.66 with a monthly close, the technical pattern suggests a measured move toward $31.87.
- Martinez has also outlined ambitious long-term price targets for Bitcoin ($190,000), Ethereum ($8,800), and Solana ($2,744) using comparable chart structures.
- An alternative two-week fractal pattern indicates XRP could deliver a 125% surge to the $3.40-$3.50 zone if historical cycles continue.
- Data from major exchanges reveals that large XRP transactions are representing an increasingly dominant portion of total outflows.
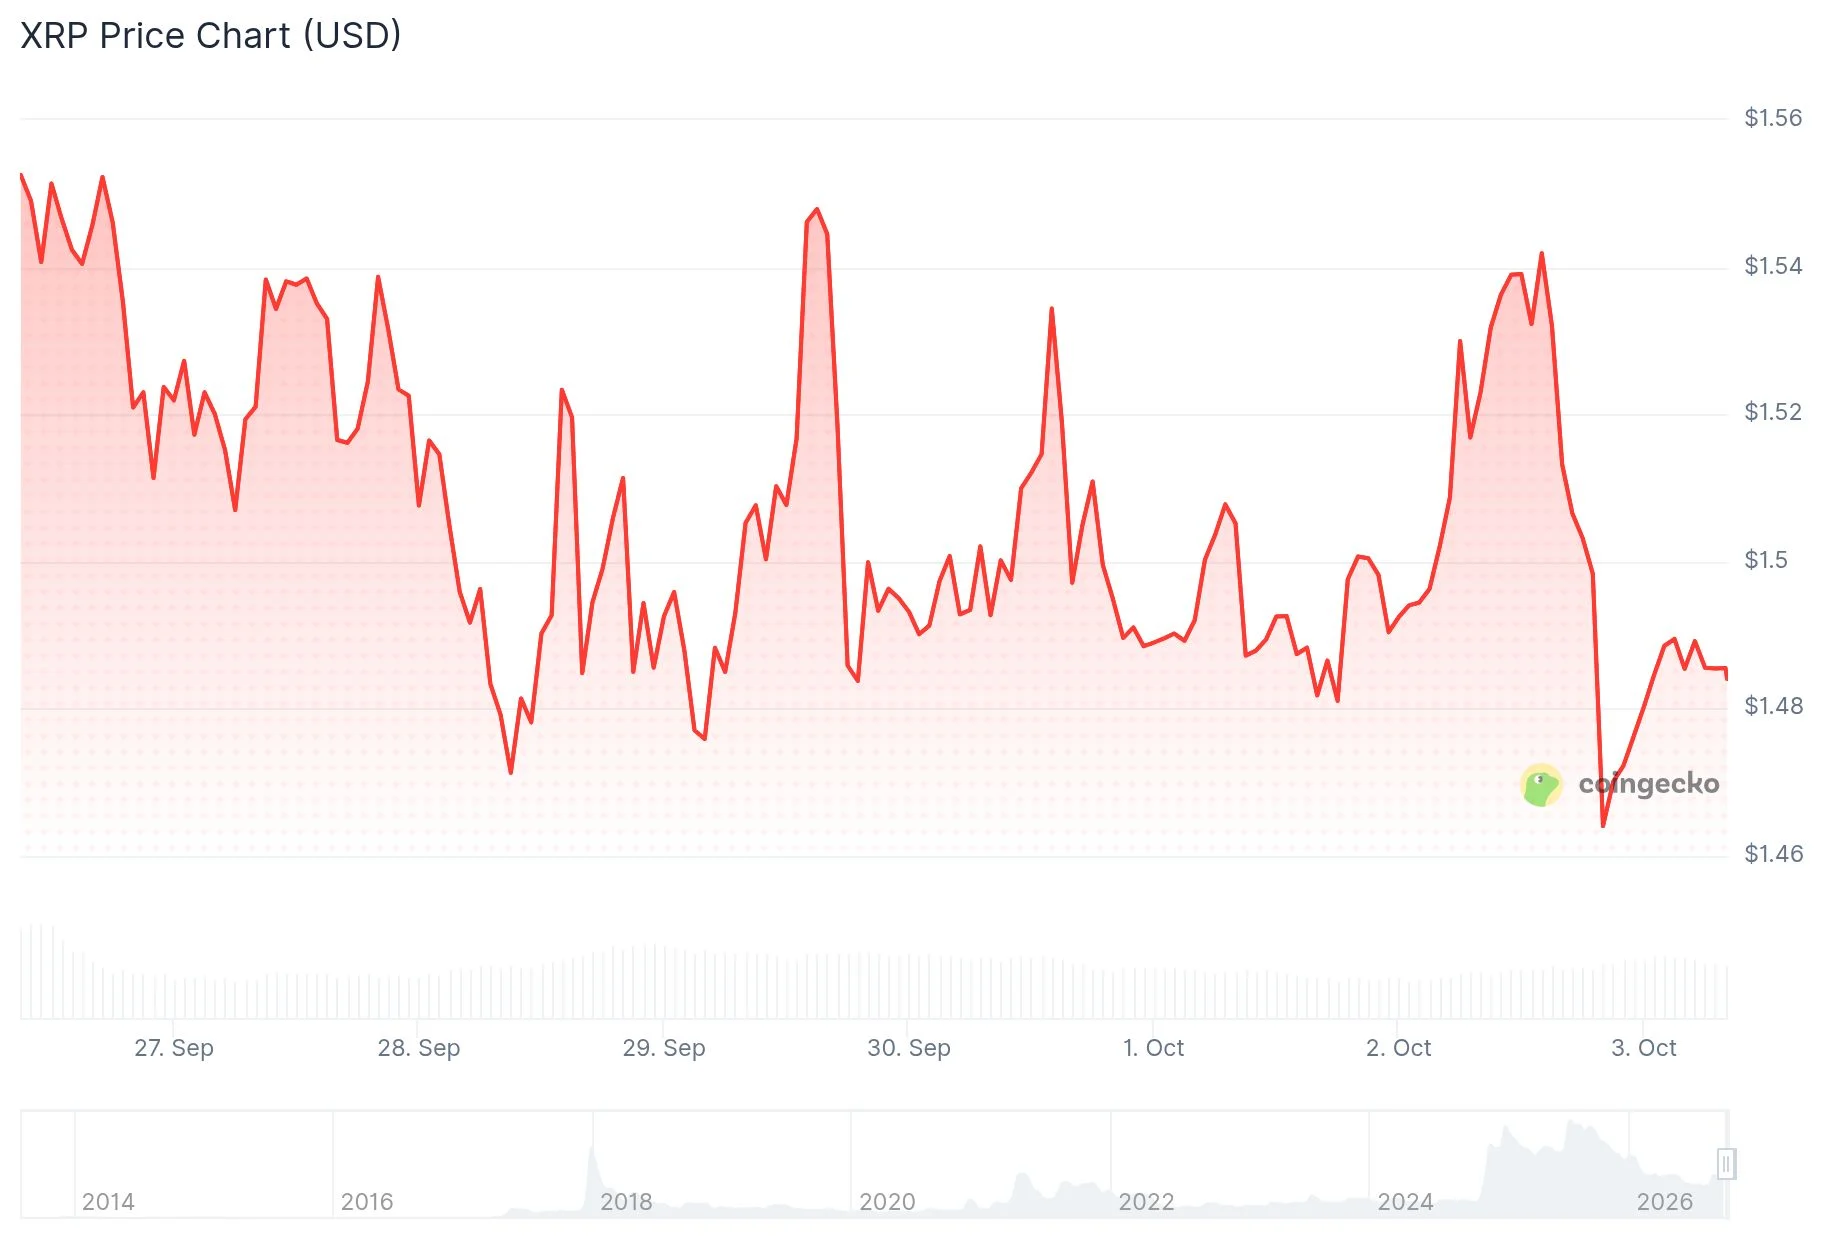
XRP changed hands near $1.48 on October 3, experiencing modest declines in the previous 24-hour period.
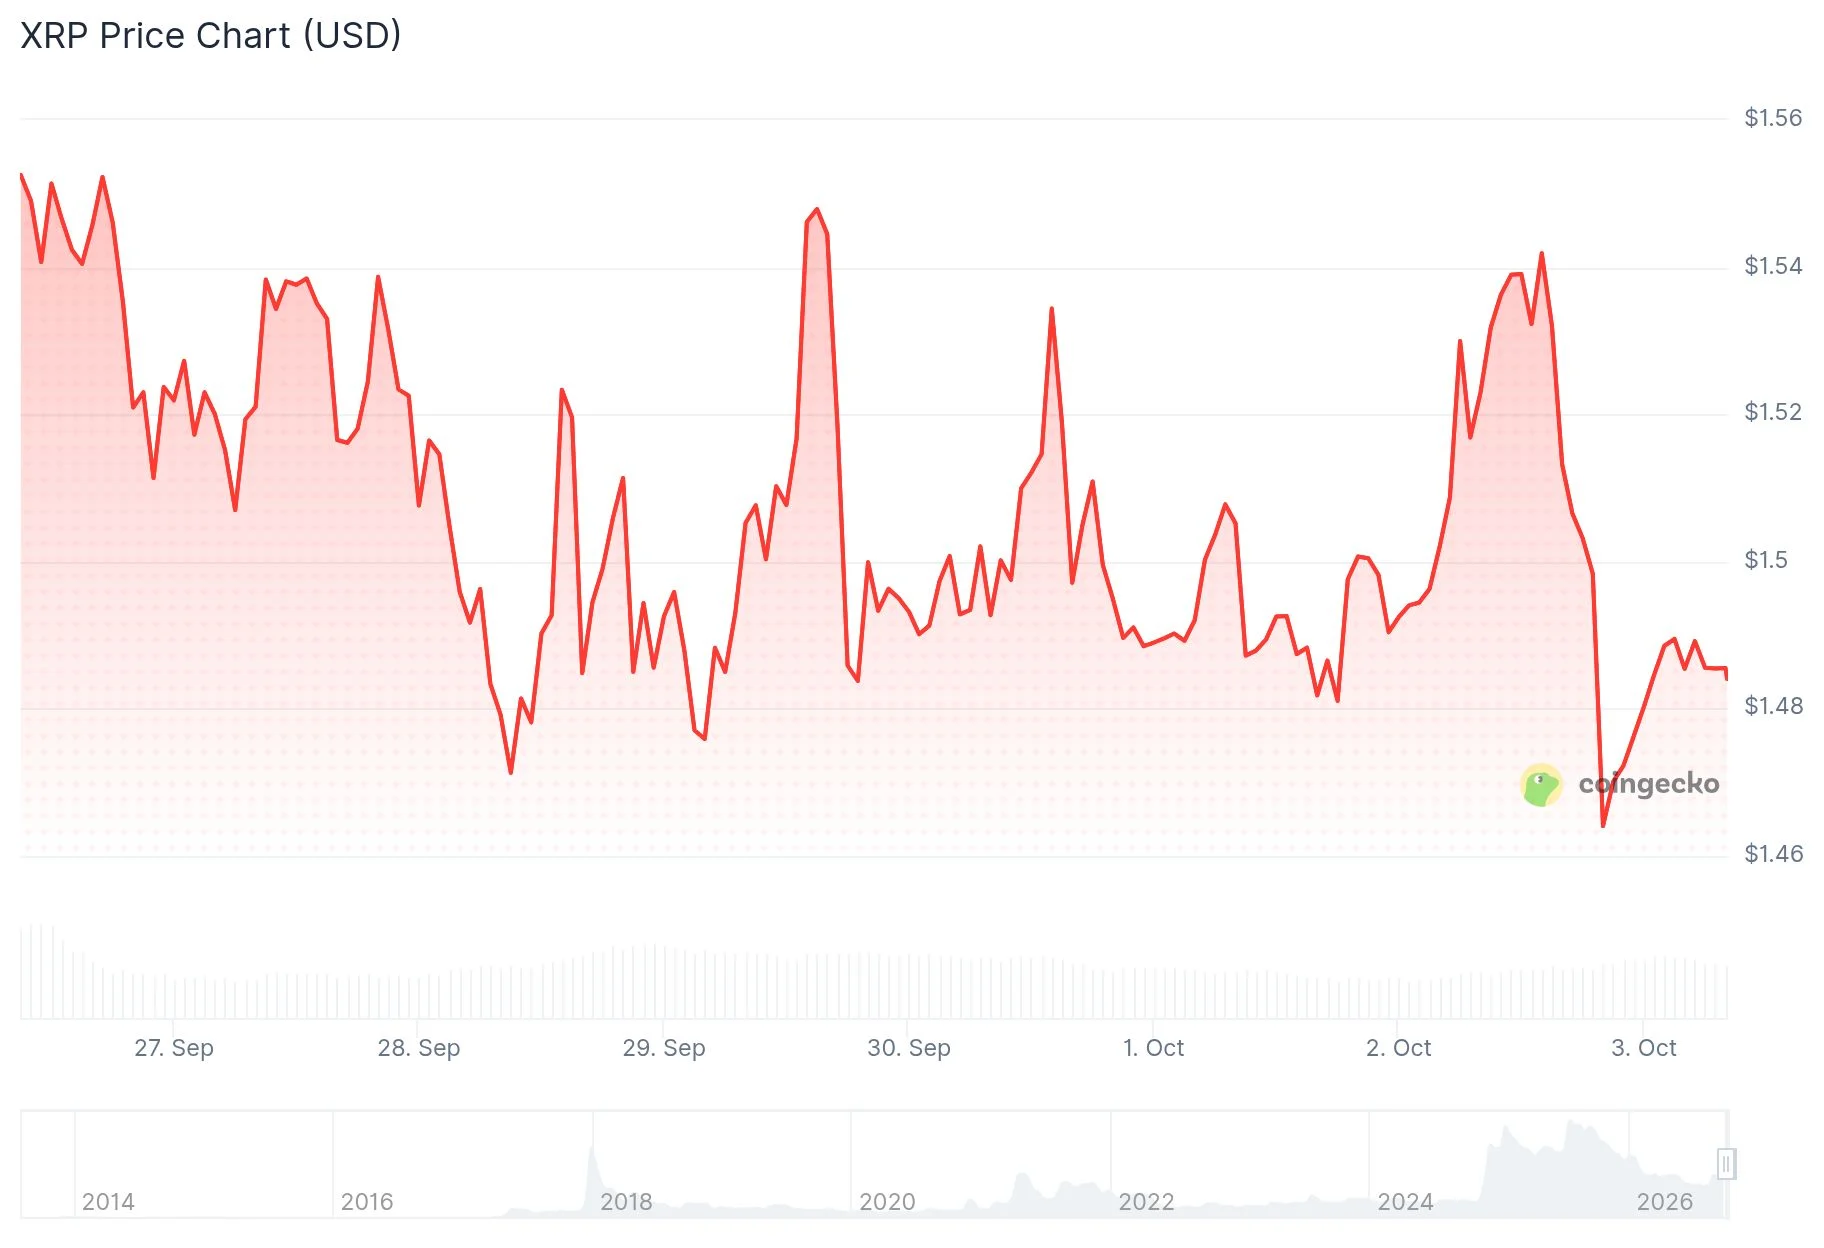
Despite the recent pullback, the digital asset has appreciated more than 50% from its August bottom, mirroring the broader cryptocurrency market’s positive momentum.
Technical strategist Ali Martinez has been examining XRP’s behavior on the monthly chart. His analysis reveals the development of an ascending triangle configuration.
This technical structure features a horizontal resistance barrier positioned near $3.66. XRP has approached this threshold multiple times but has yet to secure a monthly close beyond it.
According to Martinez, a decisive monthly candle close above $3.66 would validate the breakout. The analyst notes that applying the pattern’s measurement technique yields a price objective of $31.87.
Such an advance from present pricing to $31.87 would represent an approximate 2,000% increase. Martinez emphasizes this represents a technical projection rather than a certainty.
Cross-Asset Analysis: Bitcoin, Ethereum, And Solana Targets
Martinez extended his technical framework to several other prominent digital assets.
His Bitcoin assessment identifies a two-year rising channel formation. Should the cryptocurrency break through the upper boundary of this channel, Martinez projects a potential advance toward $190,000—approximately 125% higher than current trading levels.
Ethereum’s monthly chart displays a channel pattern that has developed over five years. If the asset rebounds from the $5,000 level, Martinez calculates a target of $8,800, representing a 231% gain.
Solana’s chart structure resembles a cup-and-handle formation with a neckline situated around $295. A confirmed breakout from this level could theoretically drive prices toward $2,744—a substantial 2,186% appreciation.
Market participant MikybullCrypto offered additional perspective on XRP’s technical positioning. The trader stated that “$XRP is one of the most bullish charts out there,” identifying a potential target window between $5 and $7 should the breakout scenario materialize.
This assessment aligns directionally with Martinez’s ascending triangle observation, though the specific price objectives differ between the two analysts.
Shorter-Timeframe Fractal Suggests Nearer-Term Rally Potential
A different technical approach from FXEmpire focuses on a recurring two-week chart fractal in XRP’s price history.
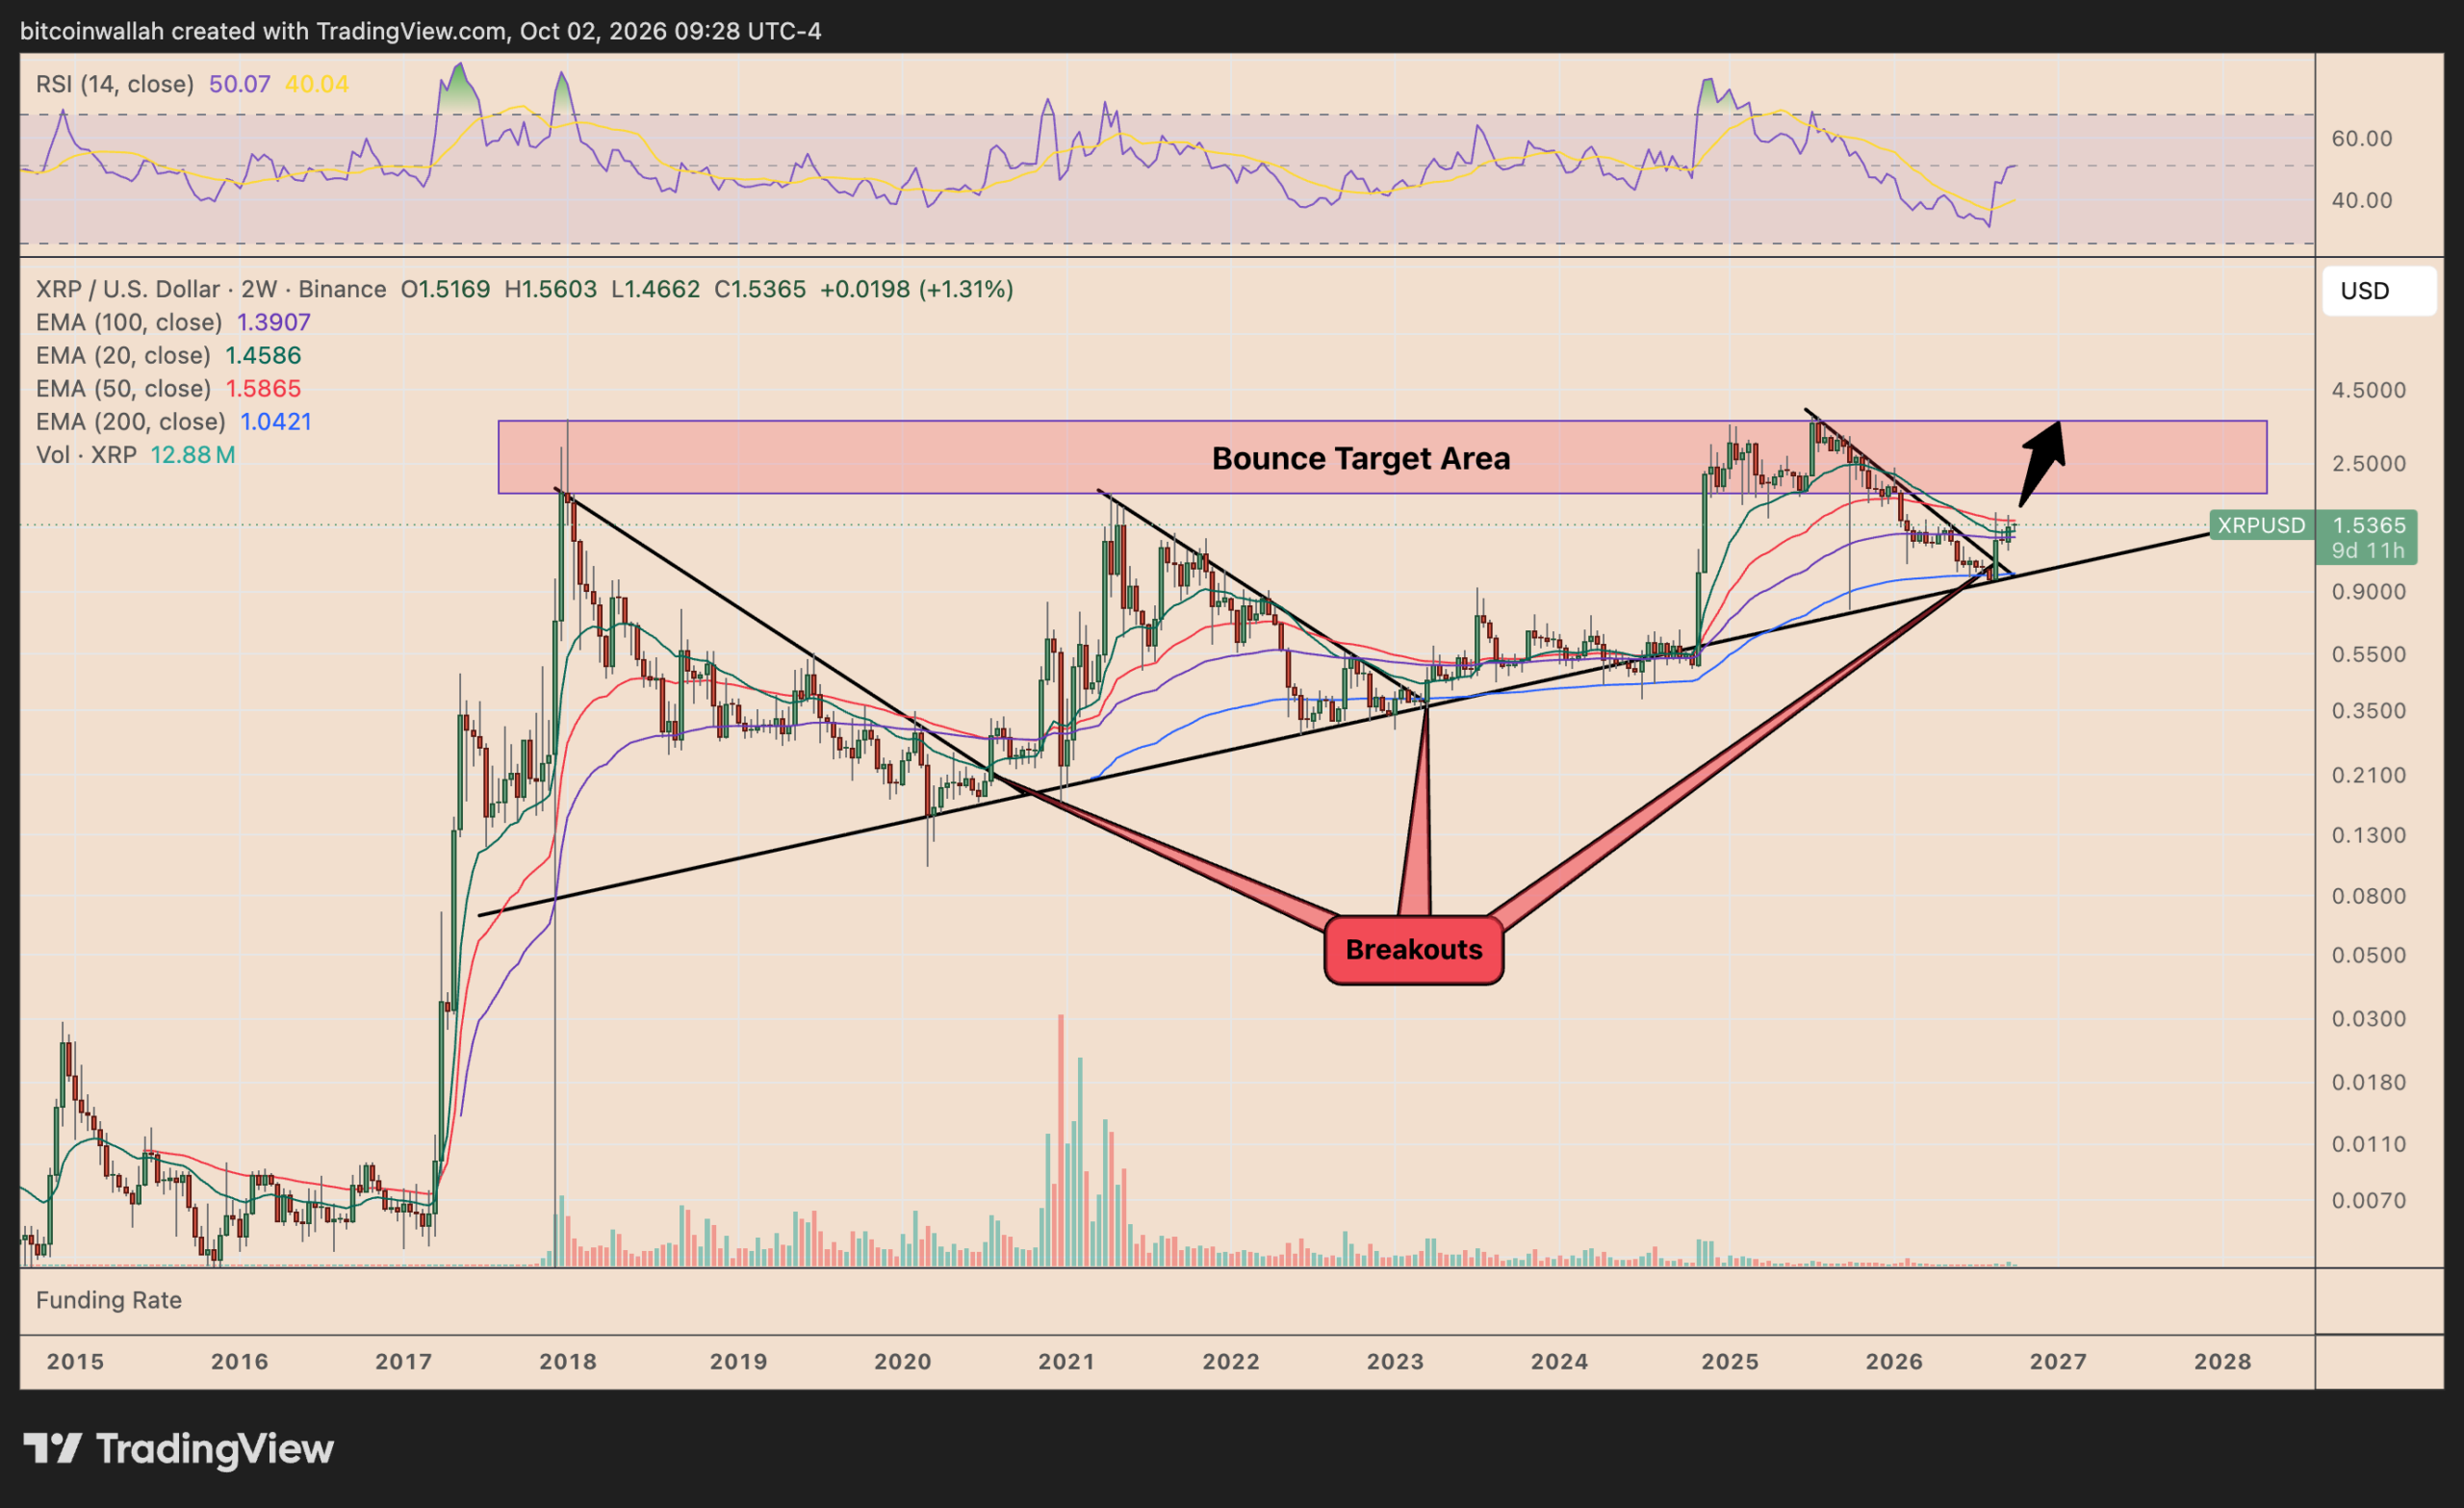
Historical data shows XRP has repeatedly developed a descending resistance trendline following major tops, while maintaining a long-duration ascending support line below.
This configuration emerged after XRP’s 2018 high, ultimately producing a 900% rally into 2021. The same structure appeared following 2021’s peak, generating a 150% advance into 2025.
The technical setup now appears to be developing for a third iteration. XRP is bouncing from the intersection where its descending resistance converges with the multi-year ascending support.
The two-week Relative Strength Index has recovered toward the 50 level. The token currently trades above both its 20-period and 100-period exponential moving averages, though a successful recapture of the 50-period EMA near $1.59 would provide additional technical confirmation.
Should this fractal pattern continue its historical behavior, XRP could reach the $3.40-$3.50 range—representing approximately 125% upside from current prices.
On-chain metrics provide supporting evidence. Binance data shows that XRP transfers exceeding 1 million tokens accounted for 60.8% of daily outflow value on September 30, climbing from approximately 45% in mid-August.
Coinbase exhibited comparable trends, with transfers above the million-token threshold reaching 48.7% of outflow value by September’s end, up from roughly 30% in early July.
The post Ascending Triangle Formation on XRP Chart Points Toward Potential $31.87 Target appeared first on Blockonomi.
This articles is written by : Nermeen Nabil Khear Abdelmalak
All rights reserved to : USAGOLDMIES . www.usagoldmines.com
You can Enjoy surfing our website categories and read more content in many fields you may like .
Why USAGoldMines ?
USAGoldMines is a comprehensive website offering the latest in financial, crypto, and technical news. With specialized sections for each category, it provides readers with up-to-date market insights, investment trends, and technological advancements, making it a valuable resource for investors and enthusiasts in the fast-paced financial world.