Bitcoin fell below $80,000, down nearly 27% from its January all-time high of $109,000
Bitcoin Rainbow Chart indicates BTC is “still cheap” and hasn’t touched bubble territory
RSI and Bitcoin dominance trends don’t match previous cycle tops, suggesting this isn’t a market top
The CME gap between $82,110 and $86,000 could signal a short-term recovery attempt
$83,000 was identified as a key support level that has now been breached
Bitcoin has experienced a downward trend recently, failing to maintain momentum after reaching its all-time high of $109,000 in January 2025. The leading cryptocurrency has declined 14.6% over the past week alone.
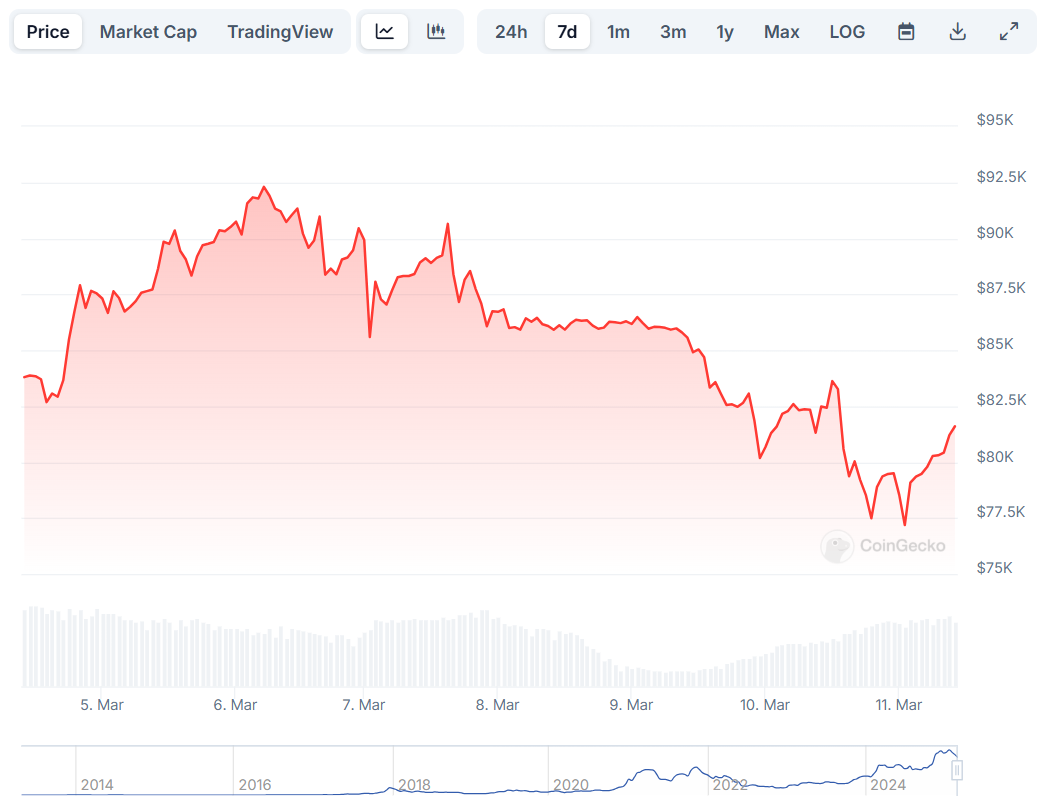
As of today, Bitcoin is trading at $79,766. This represents a drop of about 27% from its record high set earlier this year.
Bitcoin (BTC) Price
The Bitcoin Rainbow Chart, a logarithmic growth curve used to visualize long-term Bitcoin trends, currently shows that the price is “still cheap.” This popular indicator has moved from HODL territory since December to a buy signal.
In previous market cycles, this chart reached at least the “Seriously sell!” territory before major corrections. The current cycle hasn’t even tested the “Is this a bubble?” range. This suggests the market may not be near a top yet.
The weekly Relative Strength Index (RSI) tells a similar story. During the 2017 peak, Bitcoin’s RSI stayed above 70 for multiple weeks as prices reached new highs.
In 2021, the price and RSI formed a bearish divergence before Bitcoin fell nearly 50%. Recently, the RSI was above 70 for six weeks but quickly dropped below the neutral 50 mark.
This pattern looks more like the mid-cycle correction of summer 2021 than a major market top. A similar correction could take Bitcoin down to around $54,000.
Bitcoin dominance charts add another piece to the puzzle. During the last two market cycle peaks, Bitcoin’s dominance was near multi-month lows.
Currently, Bitcoin dominance is trending upward. It’s making new highs not seen since March 2021. This behavior doesn’t match what we typically see at market tops.
A gap was created when Bitcoin opened at $82,110 on the CME. The gap extends up to the $86,000 level. Historically, these gaps often get filled as Bitcoin’s price moves back to levels where trading paused.
Ibrahim notes that Bitcoin previously formed a $10,000 gap on February 28, which was filled within 19 hours. With the current gap, Bitcoin may attempt to reach the $86,000-$90,000 region within the next one to two days.
However, filling this gap wouldn’t necessarily signal a full trend reversal. The broader market direction remains uncertain through March and early April.
Another analyst has identified $83,000 as a key support level. This is based on the Realized Price of 3-6 Month UTXOs, which tracks the average acquisition price of mid-term holders.
Bitcoin recently tested this $83,000 level but has since dropped below it. This breach could shift market sentiment toward fear, potentially increasing selling pressure from mid-term holders.
If this happens, Bitcoin might enter a distribution phase where short to mid-term investors sell their holdings. The next support zone to watch is in the $78,000-$80,000 region.
Despite recent price drops, long-term investors can find comfort in the fact that current market indicators don’t match patterns seen at previous cycle tops. This suggests the market cycle may still have room to run.
This articles is written by : Nermeen Nabil Khear Abdelmalak
All rights reserved to : USAGOLDMIES . www.usagoldmines.com
You can Enjoy surfing our website categories and read more content in many fields you may like .
Why USAGoldMines ?
USAGoldMines is a comprehensive website offering the latest in financial, crypto, and technical news. With specialized sections for each category, it provides readers with up-to-date market insights, investment trends, and technological advancements, making it a valuable resource for investors and enthusiasts in the fast-paced financial world.