
Bitcoin now holds about 127.7 million Ordinal inscriptions, based on Ordiscan data from October 20, 2026. Those inscriptions store about 34.1 GB of data and have paid roughly 4,465 BTC in cumulative fees.
The numbers began to climb in 2023. They rose again when the Runes protocol launched with the April 2024 halving, and users paid more than $135 million in Runes-related fees in the first week.
Activity looks different in 2026. Average Bitcoin transaction fees have fallen to about $0.40, and the Runes sector has a market cap of about $111 million. This article reviews the data on inscriptions, fees, trading volume and market growth.
Ordinals and Runes Statistics at a Glance
The table below sets out the main figures from Ordiscan, CoinGecko, Galaxy Research and other sources. It covers inscriptions, fees, transactions and market value.
| Metric | Figure |
|---|---|
| Total inscriptions (October 20, 2026) | 127.7 million |
| Data stored in inscriptions | 34.1 GB |
| Cumulative inscription fees | 4,465 BTC |
| Runes fees in first week (April 2024) | 2,129 BTC ($135 million) |
| Runes transactions in first week | More than 3 million |
| Peak daily Runes transactions (April 23, 2024) | About 799,000 |
| Runes share of Bitcoin transactions, April to November 2024 | 56.6% average |
| Bitcoin fees on April 20, 2024 | About 1,200 BTC |
| Fees as share of miner revenue that day | About 74% |
| Average Bitcoin transaction fee, 2025 | About $1.13 |
| Average Bitcoin transaction fee, January to May 2026 | About $0.40 |
| Runes market cap (CoinGecko) | About $111 million |
| Runes 24-hour trading volume | About $423,000 |
| Bitcoin NFT sales, week ending October 20, 2026 | $9.13 million |
The data points to two phases. The first, from 2023 to 2024, was a period of fast creation and high fees. The second, in 2025 and 2026, has brought lower trading and lower fees while inscriptions keep growing.
Inscription growth is the clearest long-run trend. Bitcoin had fewer than 100,000 inscriptions in early 2023. It passed 33 million by September 2023, according to Galaxy Research.
The count passed 70 million by the end of 2024 and moved above 90 million by early 2026. Ordiscan now shows 127,698,128 inscriptions, almost four times the September 2023 total.
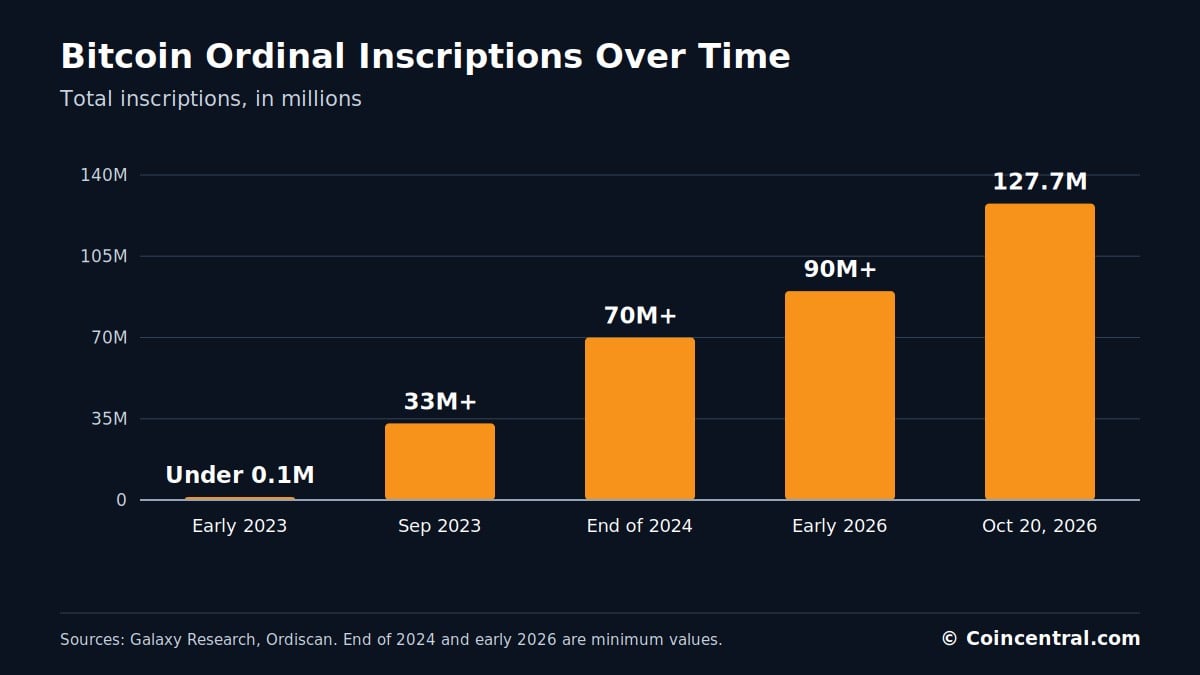
A rising count does not mean rising demand for collectibles. Many inscriptions are text or token data rather than artwork. Counting inscriptions and measuring trading are two separate things.
The 34.1 GB of stored data is the other side of the same trend. Each inscription places content on the blockchain, and every byte has to be paid for with a fee. That link between data and fees runs through the rest of this article.
How Bitcoin Ordinals and Runes Work
Ordinals were introduced by developer Casey Rodarmor. The protocol gives each satoshi, the smallest unit of Bitcoin, its own number. One bitcoin contains 100 million satoshis.
Users can attach data to a satoshi. This is called an inscription. The data can be an image, text, audio, video, software, a document or token details.
Many NFTs on other blockchains point to an image stored somewhere else. An Ordinal inscription can be stored directly on the Bitcoin blockchain. Supporters call these digital artifacts instead of standard NFTs.
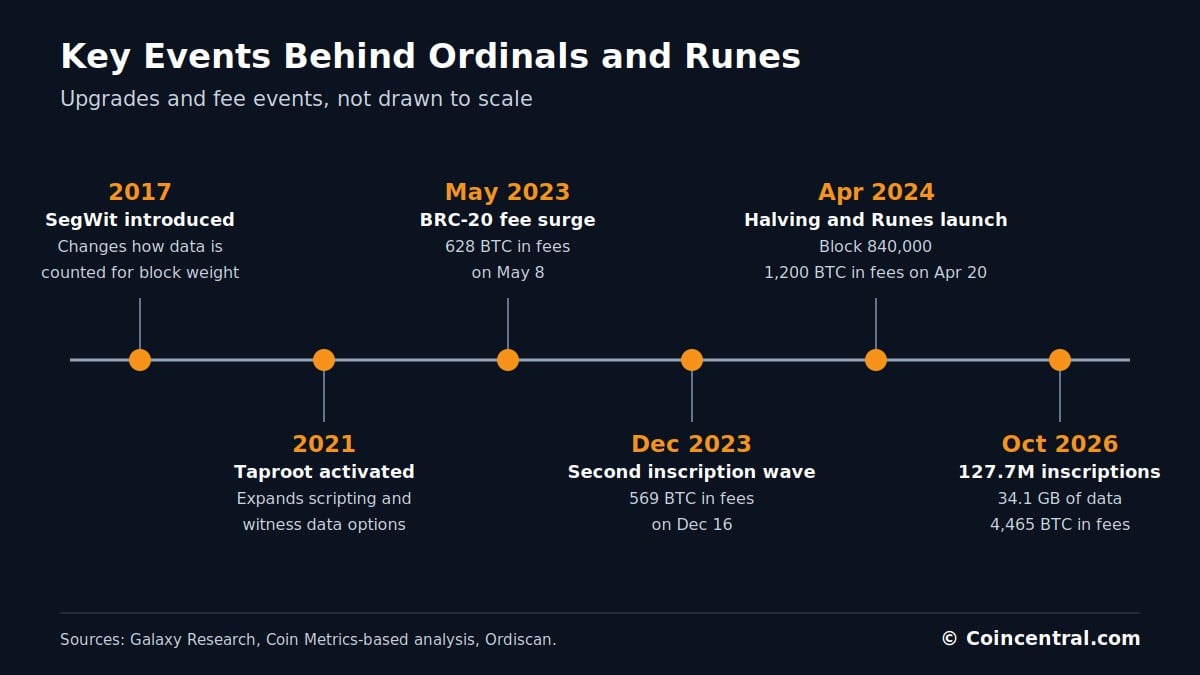
Ordinals did not need a new Bitcoin fork. Segregated Witness, or SegWit, arrived in 2017 and changed how transaction data is stored and counted for block weight. Taproot, activated in 2021, expanded scripting options and relaxed some limits on witness data.
Ordinals place content in witness data. Large inscriptions get a block-weight discount under SegWit rules, which makes storing data cheaper than it would be otherwise.
Runes came later. Rodarmor created the protocol mainly to issue fungible tokens on Bitcoin, meaning each unit is interchangeable with another, much like an ERC-20 token on Ethereum.
BRC-20 was an earlier token standard built on inscriptions. Runes were designed as a more efficient option. They use Bitcoin’s UTXO model and the OP_RETURN field instead of JSON inscription data.
This approach cuts unneeded blockchain data compared with BRC-20. BRC-20 can require several transactions to complete one token action, while Runes work within the standard Bitcoin transaction structure.
| Feature | Ordinals | BRC-20 | Runes |
|---|---|---|---|
| Main use | Collectibles and data | Fungible tokens | Fungible tokens |
| How it works | Inscriptions in witness data | Inscription-based JSON data, often several transactions per action | UTXO model and OP_RETURN field |
| Fee event linked to it | 1,779 BTC in fees in the first half of 2023 | Bitcoin fees of about 628 BTC on May 8, 2023 | Bitcoin fees of about 1,200 BTC on April 20, 2024 |
The timeline below shows when these upgrades and fee events took place.
Inscription Data and Fees Paid to Miners
Every inscription uses Bitcoin block space, so users must pay miners a fee. Ordiscan puts total cumulative inscription fees at about 4,465 BTC.
The dollar value of those fees depends on the price of Bitcoin when each fee was paid. Multiplying 4,465 BTC by today’s price would overstate what miners earned in dollar terms.
Early data shows how quickly fees built up. Galaxy Research estimated that inscriptions generated 1,779 BTC in fees in the first half of 2023. That was about 20% of all Bitcoin transaction fees in that period.
Runes added another wave in 2024. From April 19 to April 30, Bitcoin users paid about 3,077 BTC in transaction fees. That was worth roughly $200 million at the prices of the time, based on a later analysis of Coin Metrics data.
| Period | Fees (BTC) | What it covers |
|---|---|---|
| First half of 2023 | 1,779 | Inscription fees, about 20% of all Bitcoin fees |
| April 2024, Runes week one | 2,129 | Runes-related fees, about $135 million |
| April 19-30, 2024 | 3,077 | All Bitcoin transaction fees, about $200 million |
| Cumulative to October 20, 2026 | 4,465 | All inscription fees (Ordiscan) |
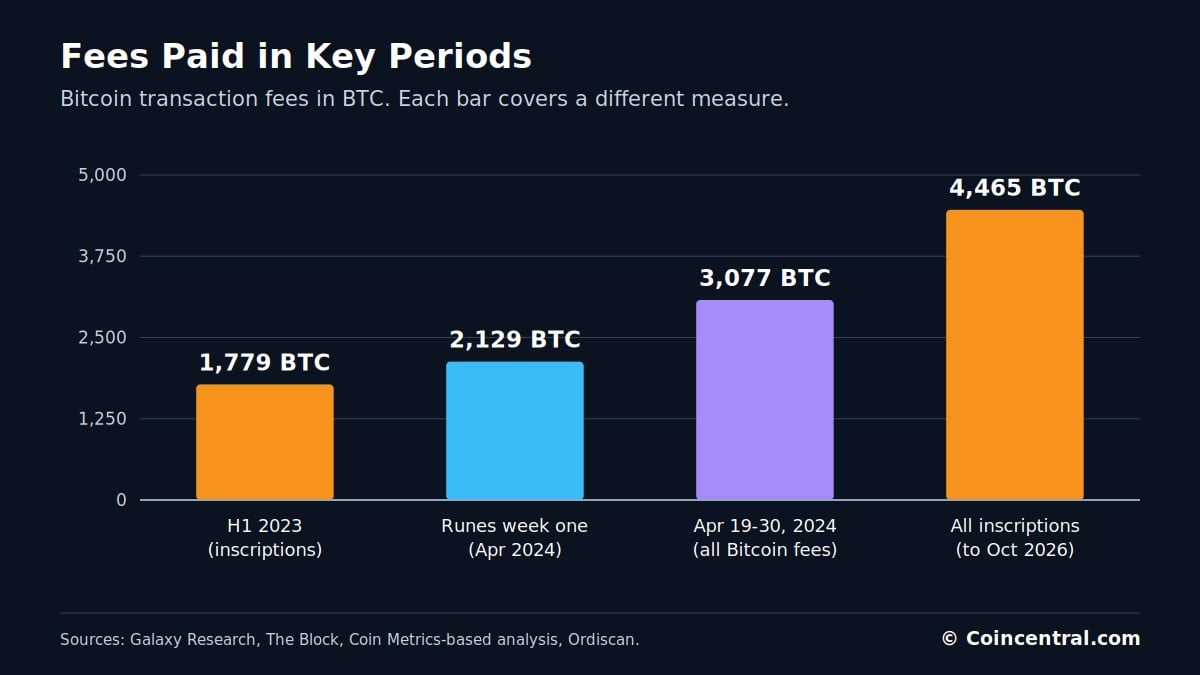
The timing mattered for miners. The block subsidy had just been cut in half at the halving, and fees helped fill the gap.
Ordinals, BRC-20 and Runes show that uses other than payments can create heavy competition for block space. That matters because the block subsidy halves about every four years. Miners will rely more on fees over time.
Fee Spikes From BRC-20 to Runes
The first major Ordinals-driven rush came in May 2023. BRC-20, an experimental token standard built with inscriptions, led to a surge in mints and transfers.
Coin Metrics-based calculations put Bitcoin fees at about 628 BTC on May 8, 2023. That was about $17 million to $18 million and about 41% of miner revenue that day.
Another wave came in December. On December 16, 2023, users paid roughly 569 BTC in fees, worth about $24 million and close to 39% of miner revenue.
| Date | Fees (BTC) | Approx. value | Share of miner revenue |
|---|---|---|---|
| May 8, 2023 | 628 | $17-18 million | About 41% |
| December 16, 2023 | 569 | About $24 million | About 39% |
| April 20, 2024 | 1,200 | About $80 million | About 74% |
The largest single day came on April 20, 2024, the day of the halving and the Runes launch. Fees reached about 1,200 BTC, or about $80 million. They made up about 74% of miner revenue.
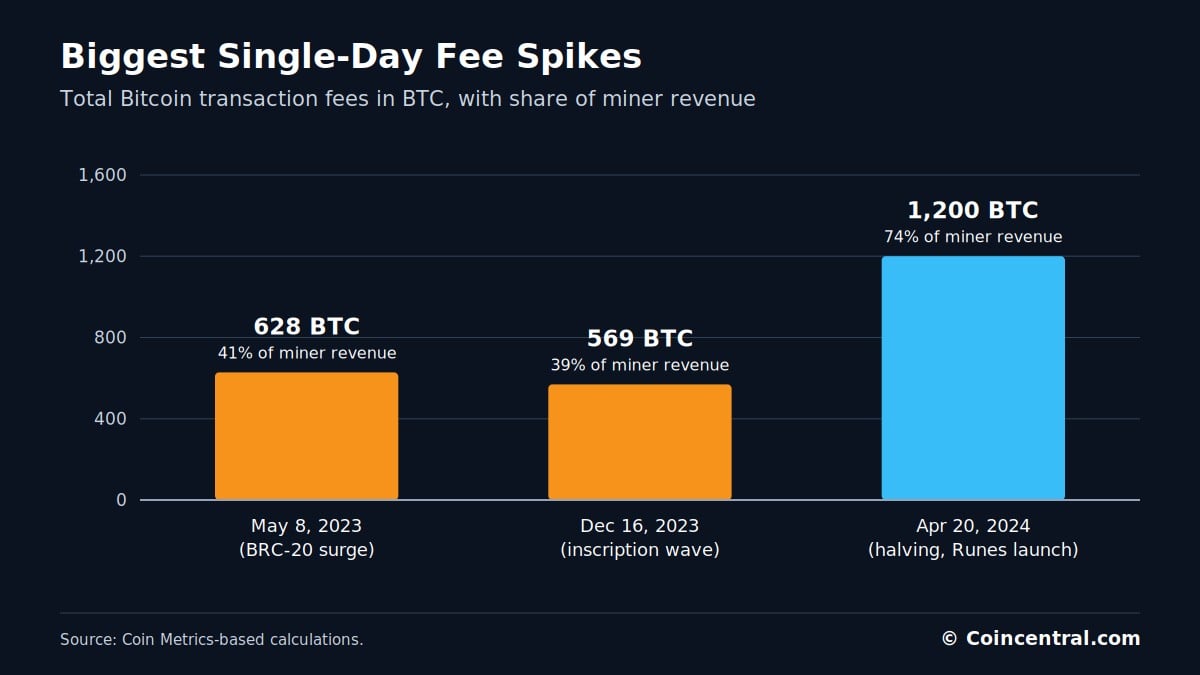
These events show that demand for tokens and collectibles can briefly become one of the biggest sources of income for Bitcoin miners. The spikes have not lasted.
Each spike came from a new type of token or inscription, not from ordinary payments. Users competed for limited block space, and the price of that space rose. When interest faded, fees fell back.
Runes Launch Week and First Month
The Runes protocol went live at block 840,000 in April 2024. In its first week, Runes generated about 2,129 BTC in transaction fees, worth more than $135 million. More than 3 million Runes transactions took place.
CoinGecko’s 2025 Bitcoin Report, which used Dune Analytics data, found 518,000 Runes transactions on launch day. Activity reached an all-time high of about 799,000 transactions on April 23, 2024.
Over the first 30 days, 92,713 Runes were created through about 7.15 million transactions. About 3.86 million of those were mint transactions.
| Measure | Figure |
|---|---|
| Fees in first week | 2,129 BTC (more than $135 million) |
| Transactions in first week | More than 3 million |
| Transactions on launch day | 518,000 |
| Peak day (April 23, 2024) | About 799,000 |
| Runes created in first 30 days | 92,713 |
| Transactions in first 30 days | About 7.15 million |
| Mint transactions in first 30 days | About 3.86 million |
The chart compares launch day, the peak day and the 30-day average. The average is calculated by dividing 7.15 million transactions by 30 days.
The launch also came at a sensitive time for miners. Bitcoin had just gone through its halving, which cut the block subsidy in half. Runes demand gave miners a burst of fee income in the same days.
Runes Share of Bitcoin Transactions
Runes made up a large part of Bitcoin activity in 2024. CoinGecko found that Runes averaged 56.6% of Bitcoin transactions between April and November 2024. At points during launch week, they were more than 80% of all Bitcoin transactions.
Binance Research used a different period and dataset. It estimated that Runes averaged about 49% of Bitcoin transactions from launch through the end of 2024. By either measure, tokens made up about half of all transactions for several months.
| Measure | Runes share | Source |
|---|---|---|
| Peak during launch week | More than 80% of transactions | CoinGecko (Dune data) |
| April to November 2024 average | 56.6% of transactions | CoinGecko (Dune data) |
| Launch to end of 2024 average | About 49% of transactions | Binance Research |
| May 20, 2024 | 17.8% of transactions, 8.7% of fees | CryptoSlate and CoinGecko data |
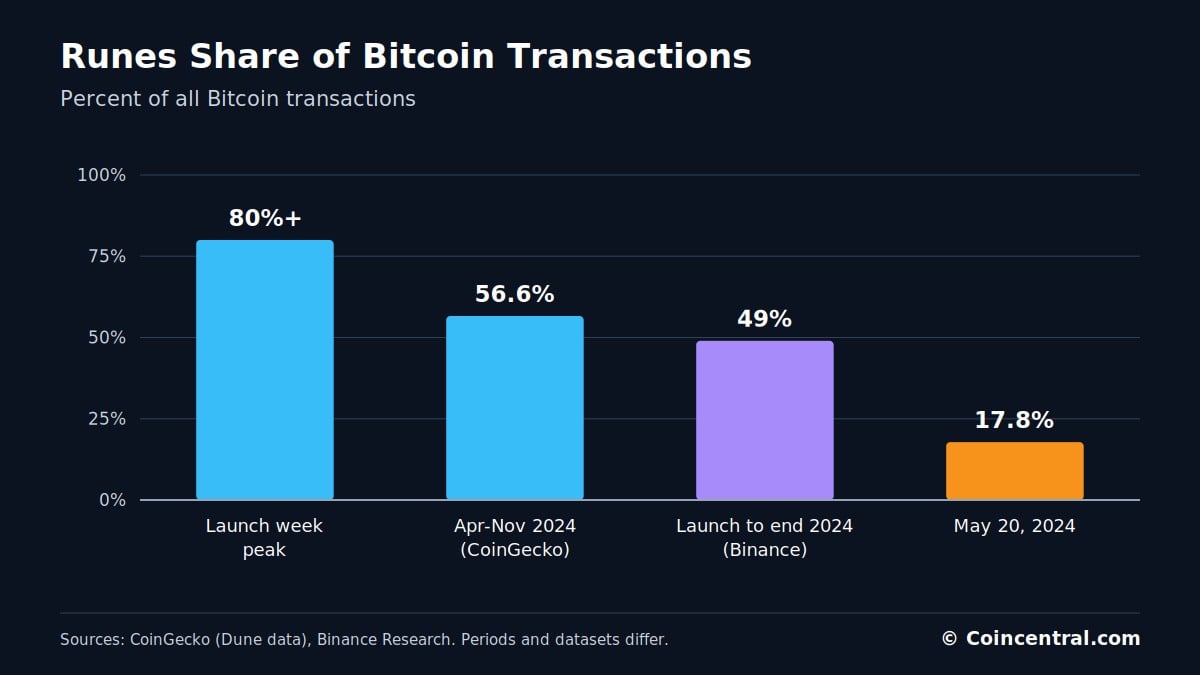
The share fell fast. By May 20, 2024, Runes made up about 17.8% of Bitcoin transactions and 8.7% of transaction fees. Their share of fees had been 70% or more around launch.
CoinGecko’s longer-term data shows activity falling further toward the end of 2024. Runes, BRC-20 and Ordinals saw occasional spikes in 2025. Daily transaction levels mostly returned to the range seen before the halving, and that has continued into 2026.
The gap between transaction share and fee share is worth noting for readers. Runes could account for a large number of transactions without paying a matching share of fees. On May 20, 2024, Runes had 17.8% of transactions but only 8.7% of fees.
Runes Market Cap and Trading Volume
Token values show the cooling most clearly. CoinGecko puts the total market cap of its tracked Runes category at about $111 million. Its 24-hour trading volume is about $423,000.
In May 2024, CoinGecko calculated that the top 10 Bitcoin Ordinals and Runes collections were worth about $1.03 billion together. Average daily trading volume for those assets was about $2.25 million.
The two figures are not a perfect match. The 2024 figure includes selected NFTs and Runes, while the current category covers tracked Runes tokens. The gap still shows how far speculative values have fallen.
| Measure | May 2024 | October 2026 |
|---|---|---|
| Market cap | About $1.03 billion (top 10 Ordinals and Runes) | About $111 million (tracked Runes) |
| Daily trading volume | About $2.25 million (average) | About $423,000 (24 hours) |
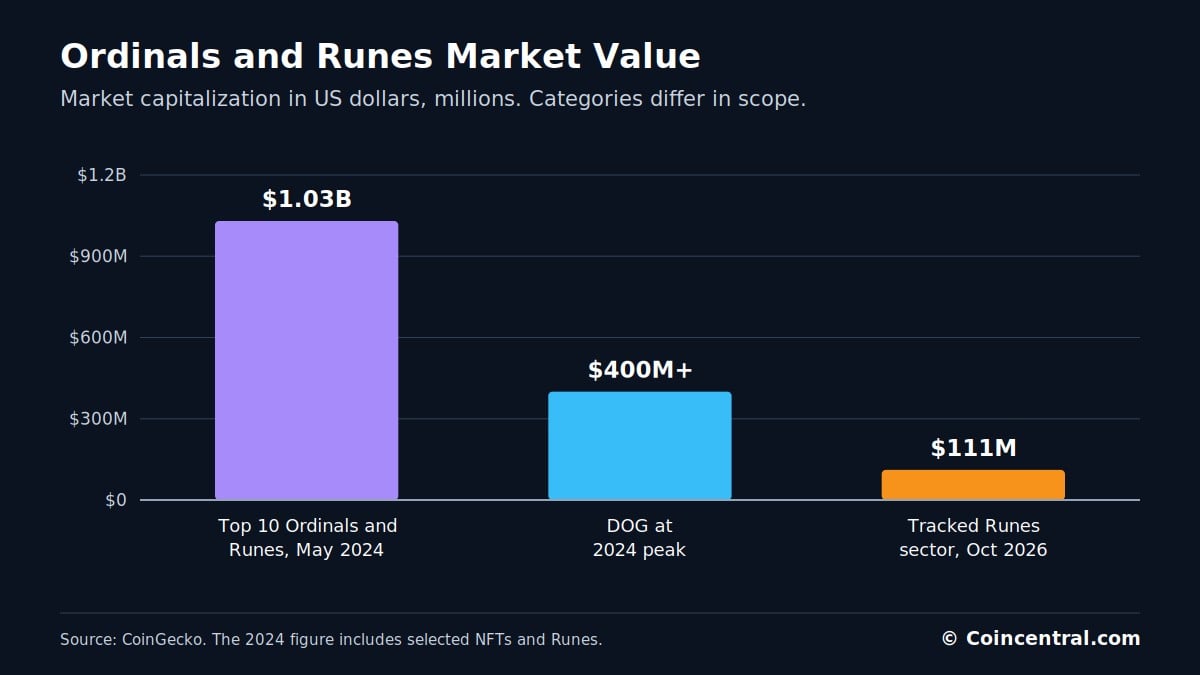
DOG•GO•TO•THE•MOON is one of the best-known Runes. It started in the Runestone ecosystem and was handed out to Ordinals holders. At its 2024 peak it had a market cap above $400 million.
That is more than three times the value of the whole tracked Runes category today.
Market cap and volume describe prices and trading, not how many people still hold these assets. They are still the main measures used to track the sector. On both, the 2026 readings sit far below the 2024 readings.
Bitcoin NFT Sales and Trading
Ordinals collectibles still have an active market. Galaxy Research found about $596 million in cumulative trading volume by September 2023, only months after launch. That made Bitcoin the third-largest blockchain for NFT trading at the time, behind Ethereum and Solana.
More recent industry estimates put lifetime Bitcoin NFT sales in the billions of dollars. CryptoSlam data cited by Bitcoin.com showed sales of $53 million in January 2026, $33.6 million in February and $46.8 million in March.
For the week ending October 20, 2026, CryptoSlam data reported by TokenPost showed $9.13 million in Bitcoin NFT sales. That was up 120% from the week before.
Bitcoin ranked second behind Ethereum’s $16.35 million. It was ahead of Polygon, BNB Chain and Solana. The week also included several large BRC-20-based NFT trades.
| Period | Bitcoin NFT sales |
|---|---|
| Cumulative to September 2023 | About $596 million |
| January 2026 | $53 million |
| February 2026 | $33.6 million |
| March 2026 | $46.8 million |
| Week ending October 20, 2026 | $9.13 million (up 120% week over week) |
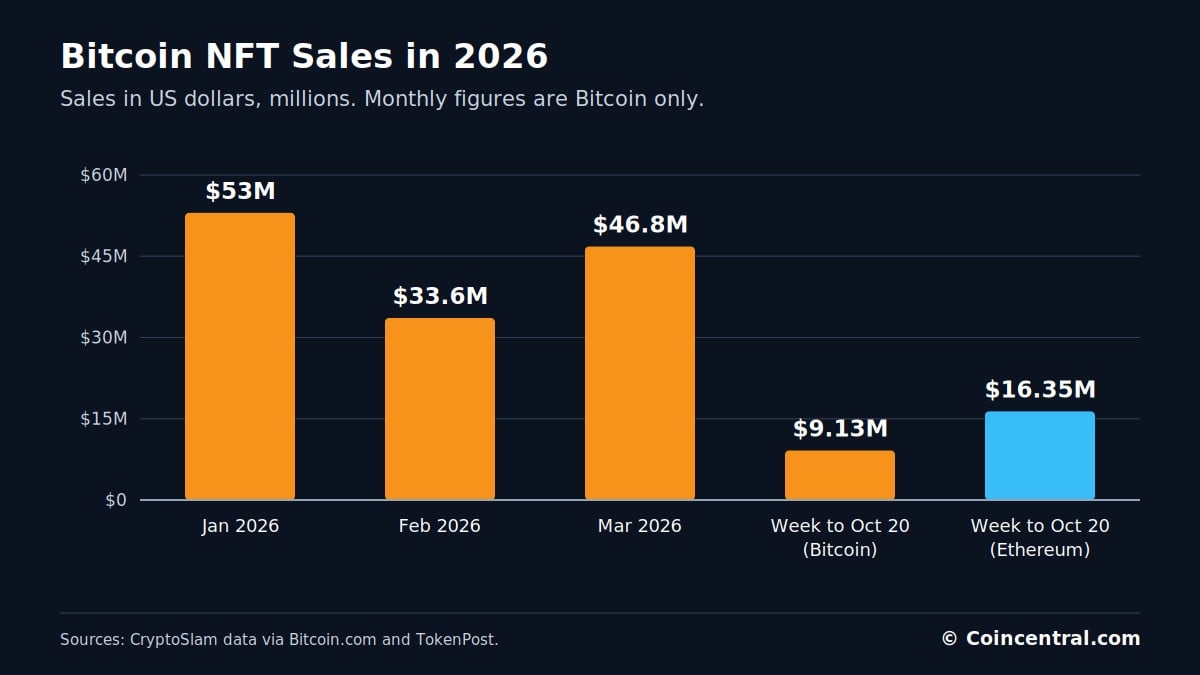
One strong week is not a return to the 2023 and 2024 boom. Inscription counts kept rising while trading weakened. Inscribing an asset and trading it are different activities.
The January to March 2026 figures show that monthly sales moved between $33.6 million and $53 million. The latest week, at $9.13 million, is a weekly figure and should not be compared directly with a full month. Even so, it ranks Bitcoin second among the blockchains CryptoSlam tracked that week.
Bitcoin Fees in 2025 and 2026
Fee demand has not held at 2024 levels. After the Runes launch, the seven-day average Bitcoin transaction fee reached about $40. A Coin Metrics-based analysis shows the yearly average has since fallen to well under $2.
Total fees fell too. The analysis calculated average fees of about 4.7 BTC per day in 2025 and 2.6 BTC per day through May 23, 2026.
| Year | Average cost per transaction | Average daily fees |
|---|---|---|
| 2023 | $5.20 | Not reported |
| 2024 | $4.81 | Not reported |
| 2025 | $1.13 | About 4.7 BTC |
| 2026 (to May 23) | $0.40 | About 2.6 BTC |
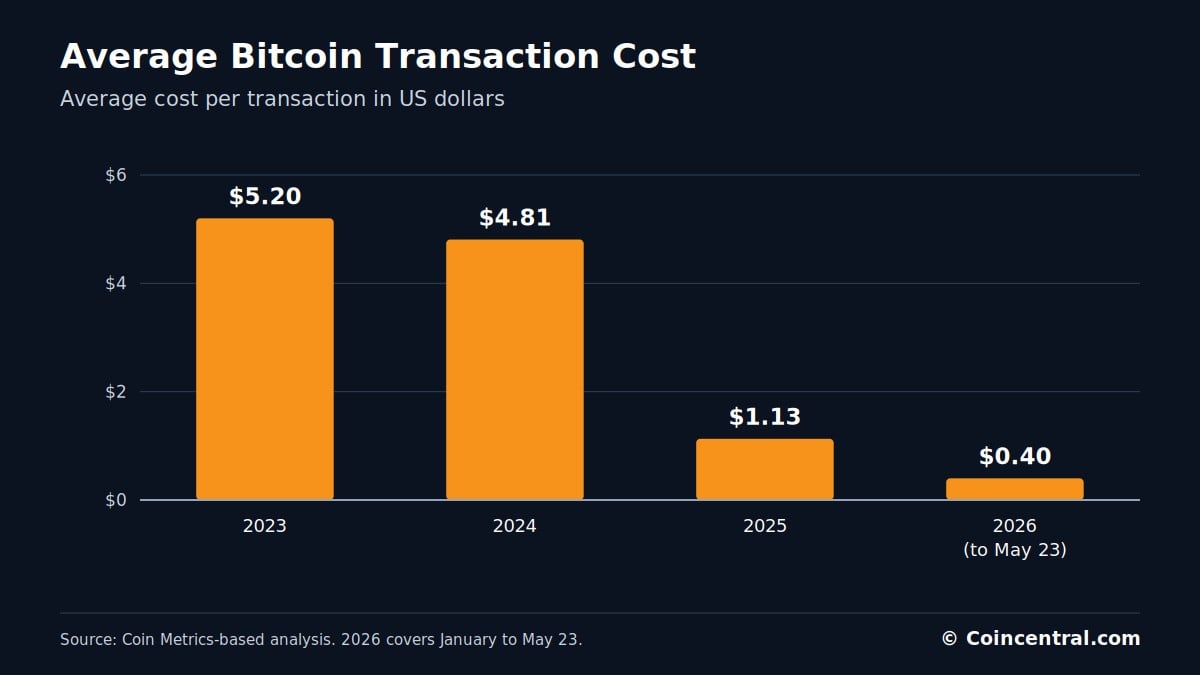
Bitcoin still handled nearly 500,000 transactions per day in 2026 under the same method. That suggests the fall reflects less competition for block space. It does not mean the network stopped processing transactions.
The drop in cost is large. The average fell from $5.20 in 2023 to $0.40 in 2026, a decline of about 92%. Average daily fees fell from about 4.7 BTC in 2025 to about 2.6 BTC in 2026, a decline of about 45%.
What Ordinals and Runes Mean for Bitcoin
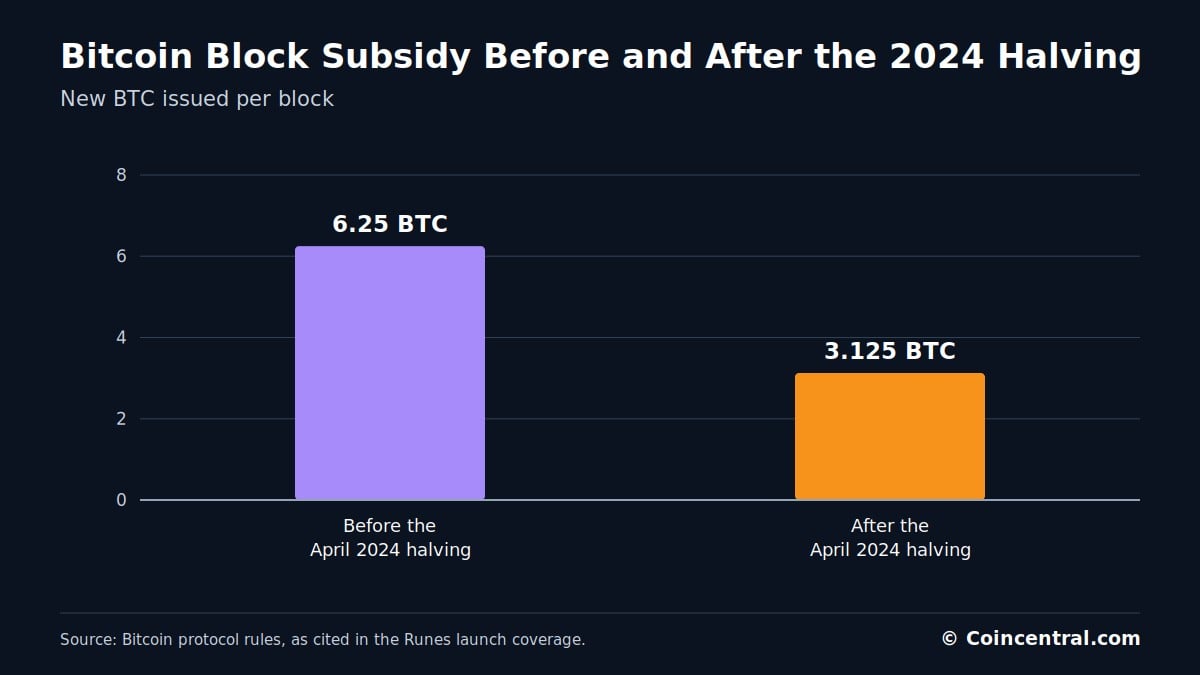
Bitcoin’s long-term model assumes fees will replace the shrinking block subsidy. The April 2024 halving cut the subsidy from 6.25 BTC to 3.125 BTC per block. For more than 100 blocks in a row after the halving, transaction fees were higher than the subsidy.
That showed that uses beyond sending BTC can create a large fee market. The 2025 and 2026 data shows the weak point in that argument. Speculative demand is cyclical.
Miners who need steady fee income cannot count on a memecoin or collectible boom every few years. Short bursts of demand are not the same as constant demand for block space.
Ordinals also changed what developers try to build. Before 2023, Bitcoin work focused on payments, Lightning, multisignature custody and financial settlement. The boom led to tests of BRC-20, Runes, rare sats, recursive inscriptions, Bitcoin NFTs, Alkanes, Bitcoin Layer 2 networks and other token protocols.
Binance Research has argued that the boom helped start a wider push to make Bitcoin more programmable. Whether those systems gain lasting use is still unclear.
For now, the evidence supports a narrow conclusion. Bitcoin can host a market for non-payment assets, and that market can pay miners when demand is high. The 2025 and 2026 numbers show that demand has not stayed at that level.
The Bottom Line
Inscriptions grew from fewer than 100,000 in early 2023 to about 127.7 million in October 2026. They hold more than 34 GB of data and have paid about 4,465 BTC in fees.
Runes had a faster rise. They produced more than $135 million in fees in week one, reached almost 800,000 transactions in a day and made up more than half of Bitcoin transactions for much of 2024.
The boom faded. In 2026, fees are near historic lows, the tracked Runes market is worth about $111 million and daily volume is under half a million dollars. Bitcoin NFT sales of $9.13 million in the latest week still ranked second behind Ethereum.
The data does not show that Ordinals and Runes failed, or that they changed Bitcoin’s economics for good. It shows that Bitcoin block space can support assets beyond BTC, and that heavy demand can pay miners well. Whether that demand becomes steady is the open question.
Sources
- Ordiscan: Ordinals Explorer. Live inscription count, data stored and cumulative inscription fees.
- CoinGecko: Top Runes Coins by Market Cap. Current Runes market capitalization and trading volume.
- CoinGecko Research: Ordinals & Runes Statistics. Historic Ordinals and Runes market capitalization and volume.
- CoinGecko: 2025 Bitcoin Report. Dune-based analysis of Bitcoin transaction activity by Ordinals, BRC-20 and Runes.
- Galaxy Research: Bitcoin Inscriptions & Ordinals: A Maturing Ecosystem. Historical inscription, trading volume and miner fee statistics.
- Galaxy Research: Bitcoin Inscriptions & Ordinals. Technical background and analysis of inscription fees and block space use.
- The Block: Runes Generate Over $135 Million in Fees in First Week. Runes launch transactions and fee statistics.
- The Block: Bitcoin Fees After the Runes Launch. Miner revenue, transaction fees and post-halving network activity.
- CryptoSlate: 30 Days of Runes. First-month Runes creation, transaction and fee share statistics using Dune data.
- TokenPost and CryptoSlam: Bitcoin NFT Sales, October 2026. Latest weekly Bitcoin NFT sales, buyers and blockchain ranking.
- Ordinals Documentation. Technical specification and background for the Ordinals protocol.
- Magic Eden: Bitcoin Ordinals Guide. Marketplace information and Ordinals collection data.
The post Bitcoin Ordinals and Runes Statistics 2026: Fees, Trading Volume and Market Growth appeared first on Blockonomi.
This articles is written by : Nermeen Nabil Khear Abdelmalak
All rights reserved to : USAGOLDMIES . www.usagoldmines.com
You can Enjoy surfing our website categories and read more content in many fields you may like .
Why USAGoldMines ?
USAGoldMines is a comprehensive website offering the latest in financial, crypto, and technical news. With specialized sections for each category, it provides readers with up-to-date market insights, investment trends, and technological advancements, making it a valuable resource for investors and enthusiasts in the fast-paced financial world.