
Bitcoin is trying to stabilize around $64K after a week-long sell-off briefly pushed it to about $62,000, its lowest since July. Markets now expect the Fed to raise rates again in December, after hotter inflation data and hawkish comments from Fed officials.
At the same time, U.S. spot Bitcoin ETFs recorded net outflows for seven straight trading sessions through Nov. 13, totaling about $1.91 billion. Meanwhile, the Futures Average Order Size metric shows large orders dominated the final leg lower. This pattern has appeared near earlier capitulation phases.
Bitcoin Price Analysis: The Daily Chart
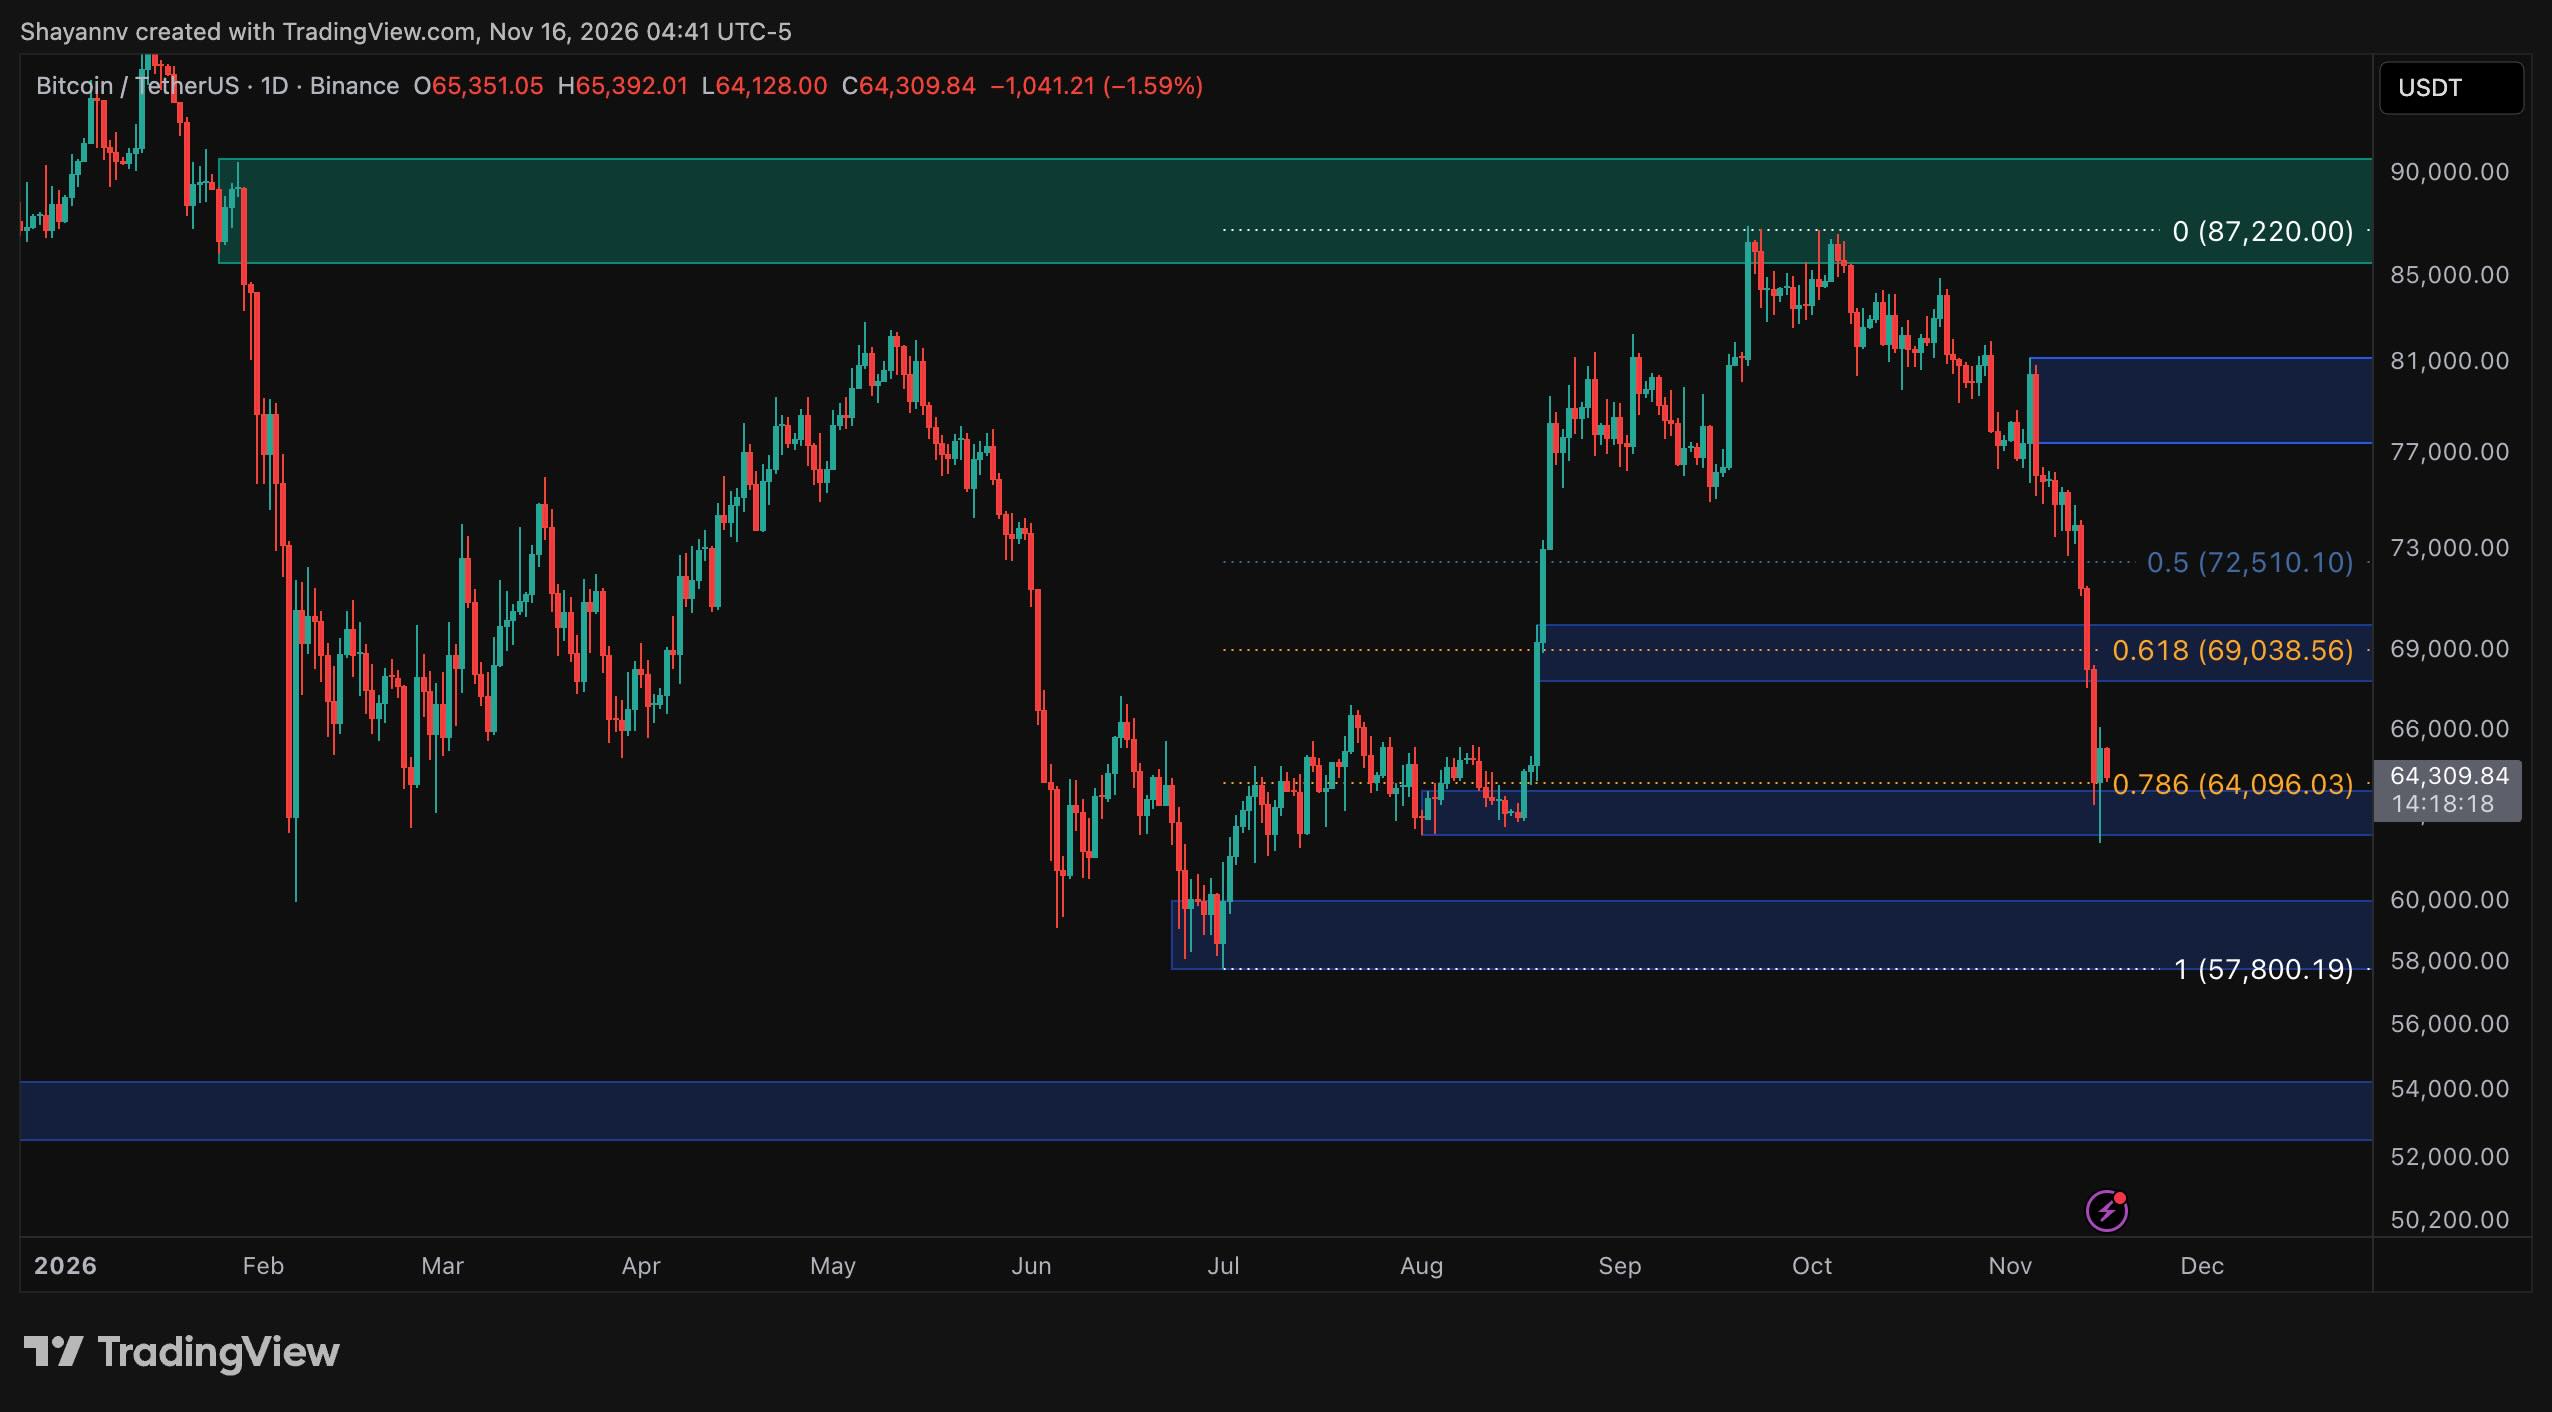
On the daily timeframe, the sell-off has erased most of the rally that began at the $58K July low and peaked near $87K in late September.
Once BTC broke below $80K in early November, the decline accelerated. It cut through the 0.5 ($72.5K) and 0.618 ($69K) Fibonacci retracement levels of that advance in only a few sessions, which left no time for base-building at either level.
Bitcoin now sits on the 0.786 retracement level around $64K. This level overlaps with the $64K demand zone, where the price consolidated through August before surging. The long lower wick into the zone suggests buyers responded, but the rebound has been modest so far.
A decisive daily close below $62K would invalidate this confluence and expose the $58K-$60K region, the base of the entire summer rally, with the $54K demand zone further below.
On the upside, the first hurdle is the $69K area, where the 0.618 level meets the origin of the mid-August breakout. It would likely act as overhead supply. Reclaiming it would open room toward $72.5K, but the $80K zone is the level that would need to be recovered to repair the broader structure. Until then, any advance is better read as a relief rally within a deep retracement than as a resumption of the uptrend.
BTC/USDT 4-Hour Chart
The 4-hour chart shows how one-sided the decline has been. BTC failed to hold the $76K support in early November and then printed a sequence of lower highs and lower lows. Selling accelerated once $74K gave way in recent days.
The cascade paused only when price wicked into the $63K demand zone and bounced.
In the immediate term, Bitcoin is consolidating between approximately $63K and $68K.
A rebound could extend the relief bounce toward $70K, where the final breakdown leg began, and sellers are likely to be waiting. Losing $62K-$63K, on the other hand, would put the $60K region back into play, with little structure in between.
The 4-hour RSI fell to approximately 15 during the crash, a deeply oversold reading, and has since recovered to around 32.
This suggests the most intense selling has eased, but momentum is still bearish and well below the neutral 50 level. Therefore, short-term control would only shift if the indicator moved back above 50 while the price reclaimed the $68K-$70K supply zone.

On-Chain Analysis
The Futures Average Order Size metric on CryptoQuant tracks the average size of orders executed in Bitcoin’s futures market. It classifies each period by whether retail traders, small whales, or big whales dominate activity. During the drop from $75K, the readings flipped from normal to big whale orders. This coincided with $2.02 billion in liquidations over 24 hours, including $1.68 billion in long positions, which is consistent with large leveraged longs being force-closed through market orders.
However, the metric does not show direction. It cannot tell forced selling apart from large players absorbing it.
Historically, big whale clusters have appeared late in liquidation-driven declines rather than at their start. They dominated the February crash toward $63K, and the July low near $58K, and both episodes were followed by stabilization.
Retail-dominated phases, by contrast, lined up with the 2025 top and the bleed lower that followed.
The current reading therefore points to a capitulation-type phase, in which leverage is being flushed, and large participants are active on both sides. With ETF outflows and rate-hike expectations still unresolved, the flush alone does not confirm a bottom. Whether the $63K-$64K zone holds should show whether the large orders mark absorption, as they did in July, or the start of a deeper deleveraging toward $58K.

The post Bitcoin Price Analysis: Is the Worst Over, or Is BTC Heading for $58K? appeared first on CryptoPotato.
Bitcoin is trying to stabilize around $64K after a week-long sell-off briefly pushed it to about $62,000, its lowest since July. Markets now expect the Fed to raise rates again in December, after hotter inflation data and hawkish comments from Fed officials. At the same time, U.S. spot Bitcoin ETFs recorded net outflows for seven BTC Analysis, Crypto News, Bitcoin (BTC) Price
This articles is written by : Nermeen Nabil Khear Abdelmalak
All rights reserved to : USAGOLDMIES . www.usagoldmines.com
You can Enjoy surfing our website categories and read more content in many fields you may like .
Why USAGoldMines ?
USAGoldMines is a comprehensive website offering the latest in financial, crypto, and technical news. With specialized sections for each category, it provides readers with up-to-date market insights, investment trends, and technological advancements, making it a valuable resource for investors and enthusiasts in the fast-paced financial world.