Bitcoin is trading around $74.6k, posting one of its more meaningful recovery moves in recent weeks. The market is responding to improving geopolitical sentiment surrounding the US-Iran ceasefire negotiations. The broader downtrend has not been reversed yet, but the recent push is the closest BTC has come to challenging key structural resistance since the February crash, and the next few days could prove decisive.
Bitcoin Price Analysis: The Daily Chart
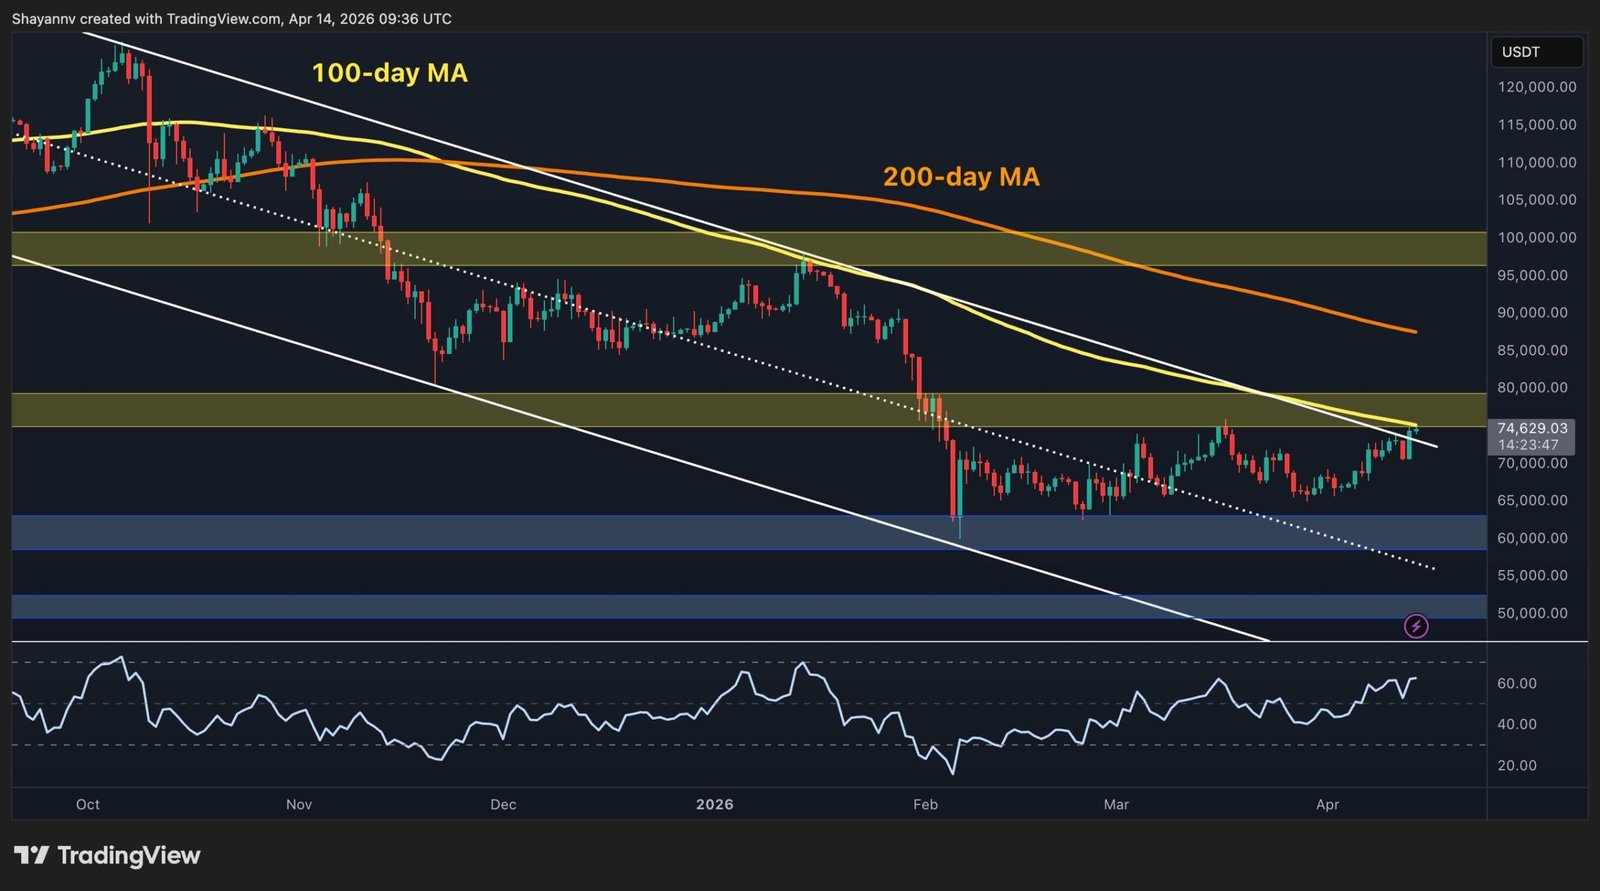
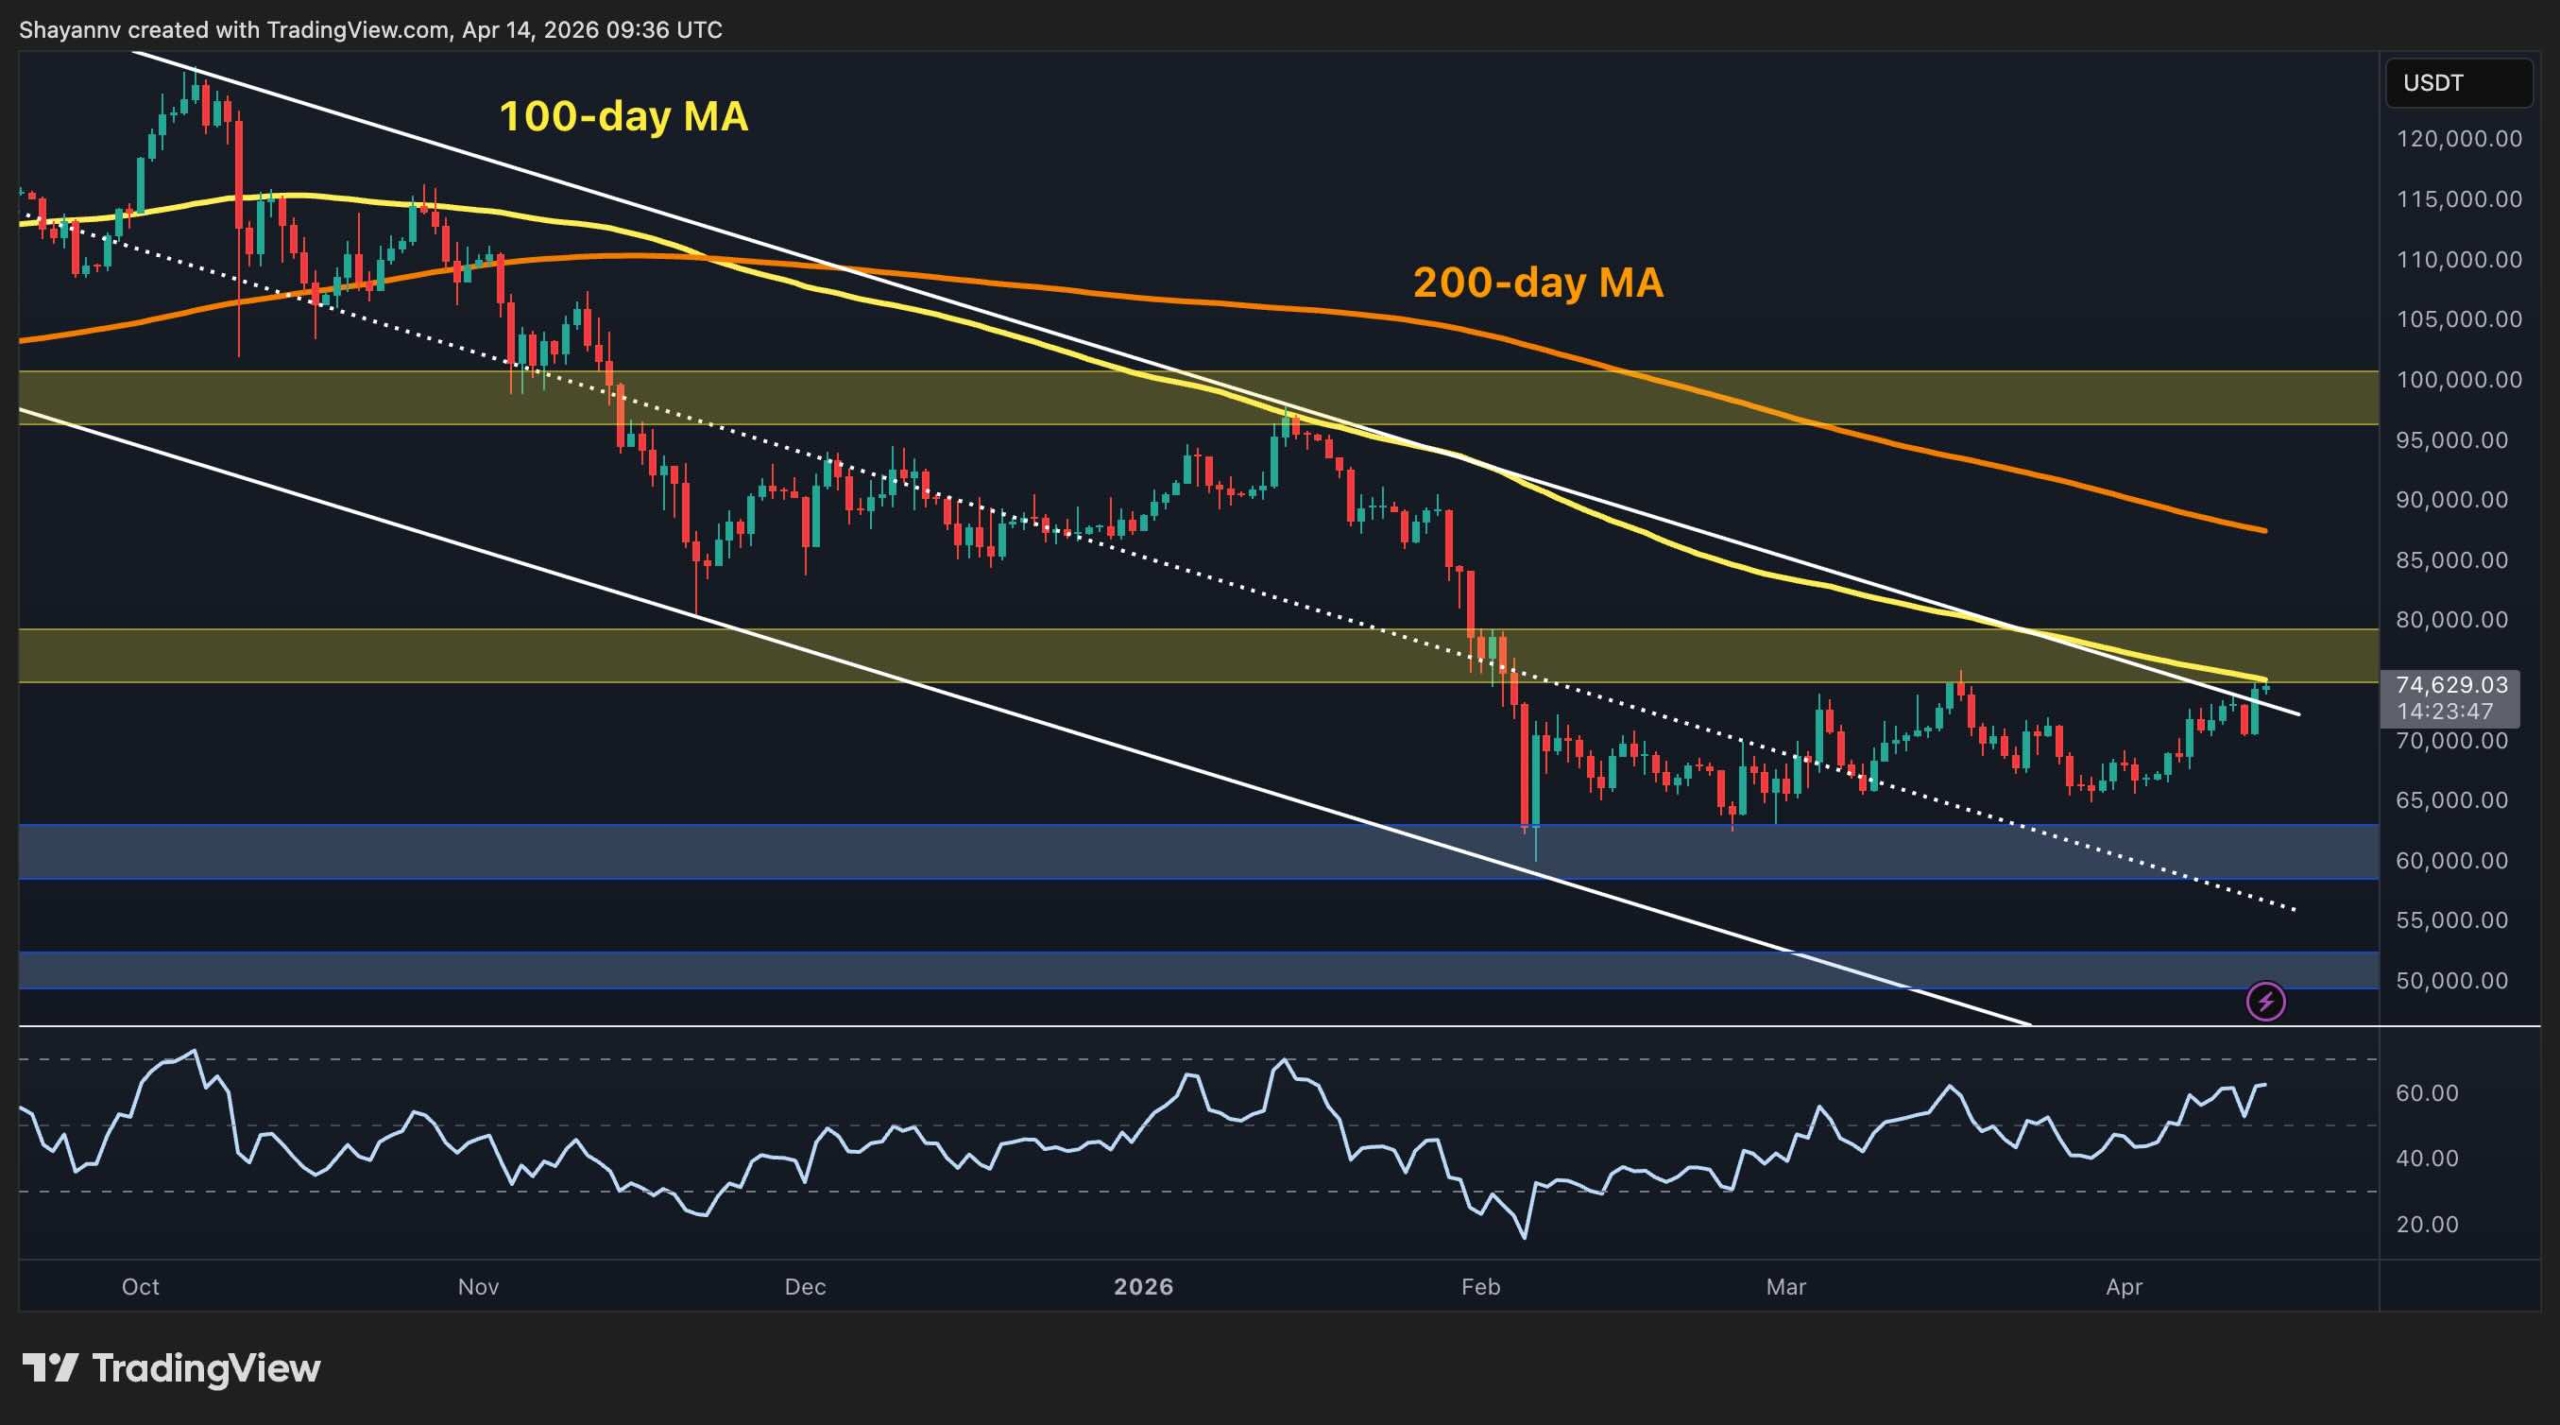
For the second time in the past couple of months, BTC is pressing directly into the $75k–$80k resistance band on the daily chart. This zone has rejected the previous recovery attempt and coincides with the converging 100-day moving average (~$75k) and the channel’s upper boundary. The fact that the asset is now testing this area with the RSI trending into the 60s gives the current attempt more credibility than prior ones.
A sustained daily close above $80k would be a structurally significant development and would mean that the price finally breaks out of the descending channel that has dominated since the October 2025 highs. Until that happens, the resistance zone deserves respect, as it has held decisively for the past few months. Meanwhile, the support level at $60k remains the key downside area to watch if another rejection from the current supply zone occurs.
BTC/USDT 4-Hour Chart
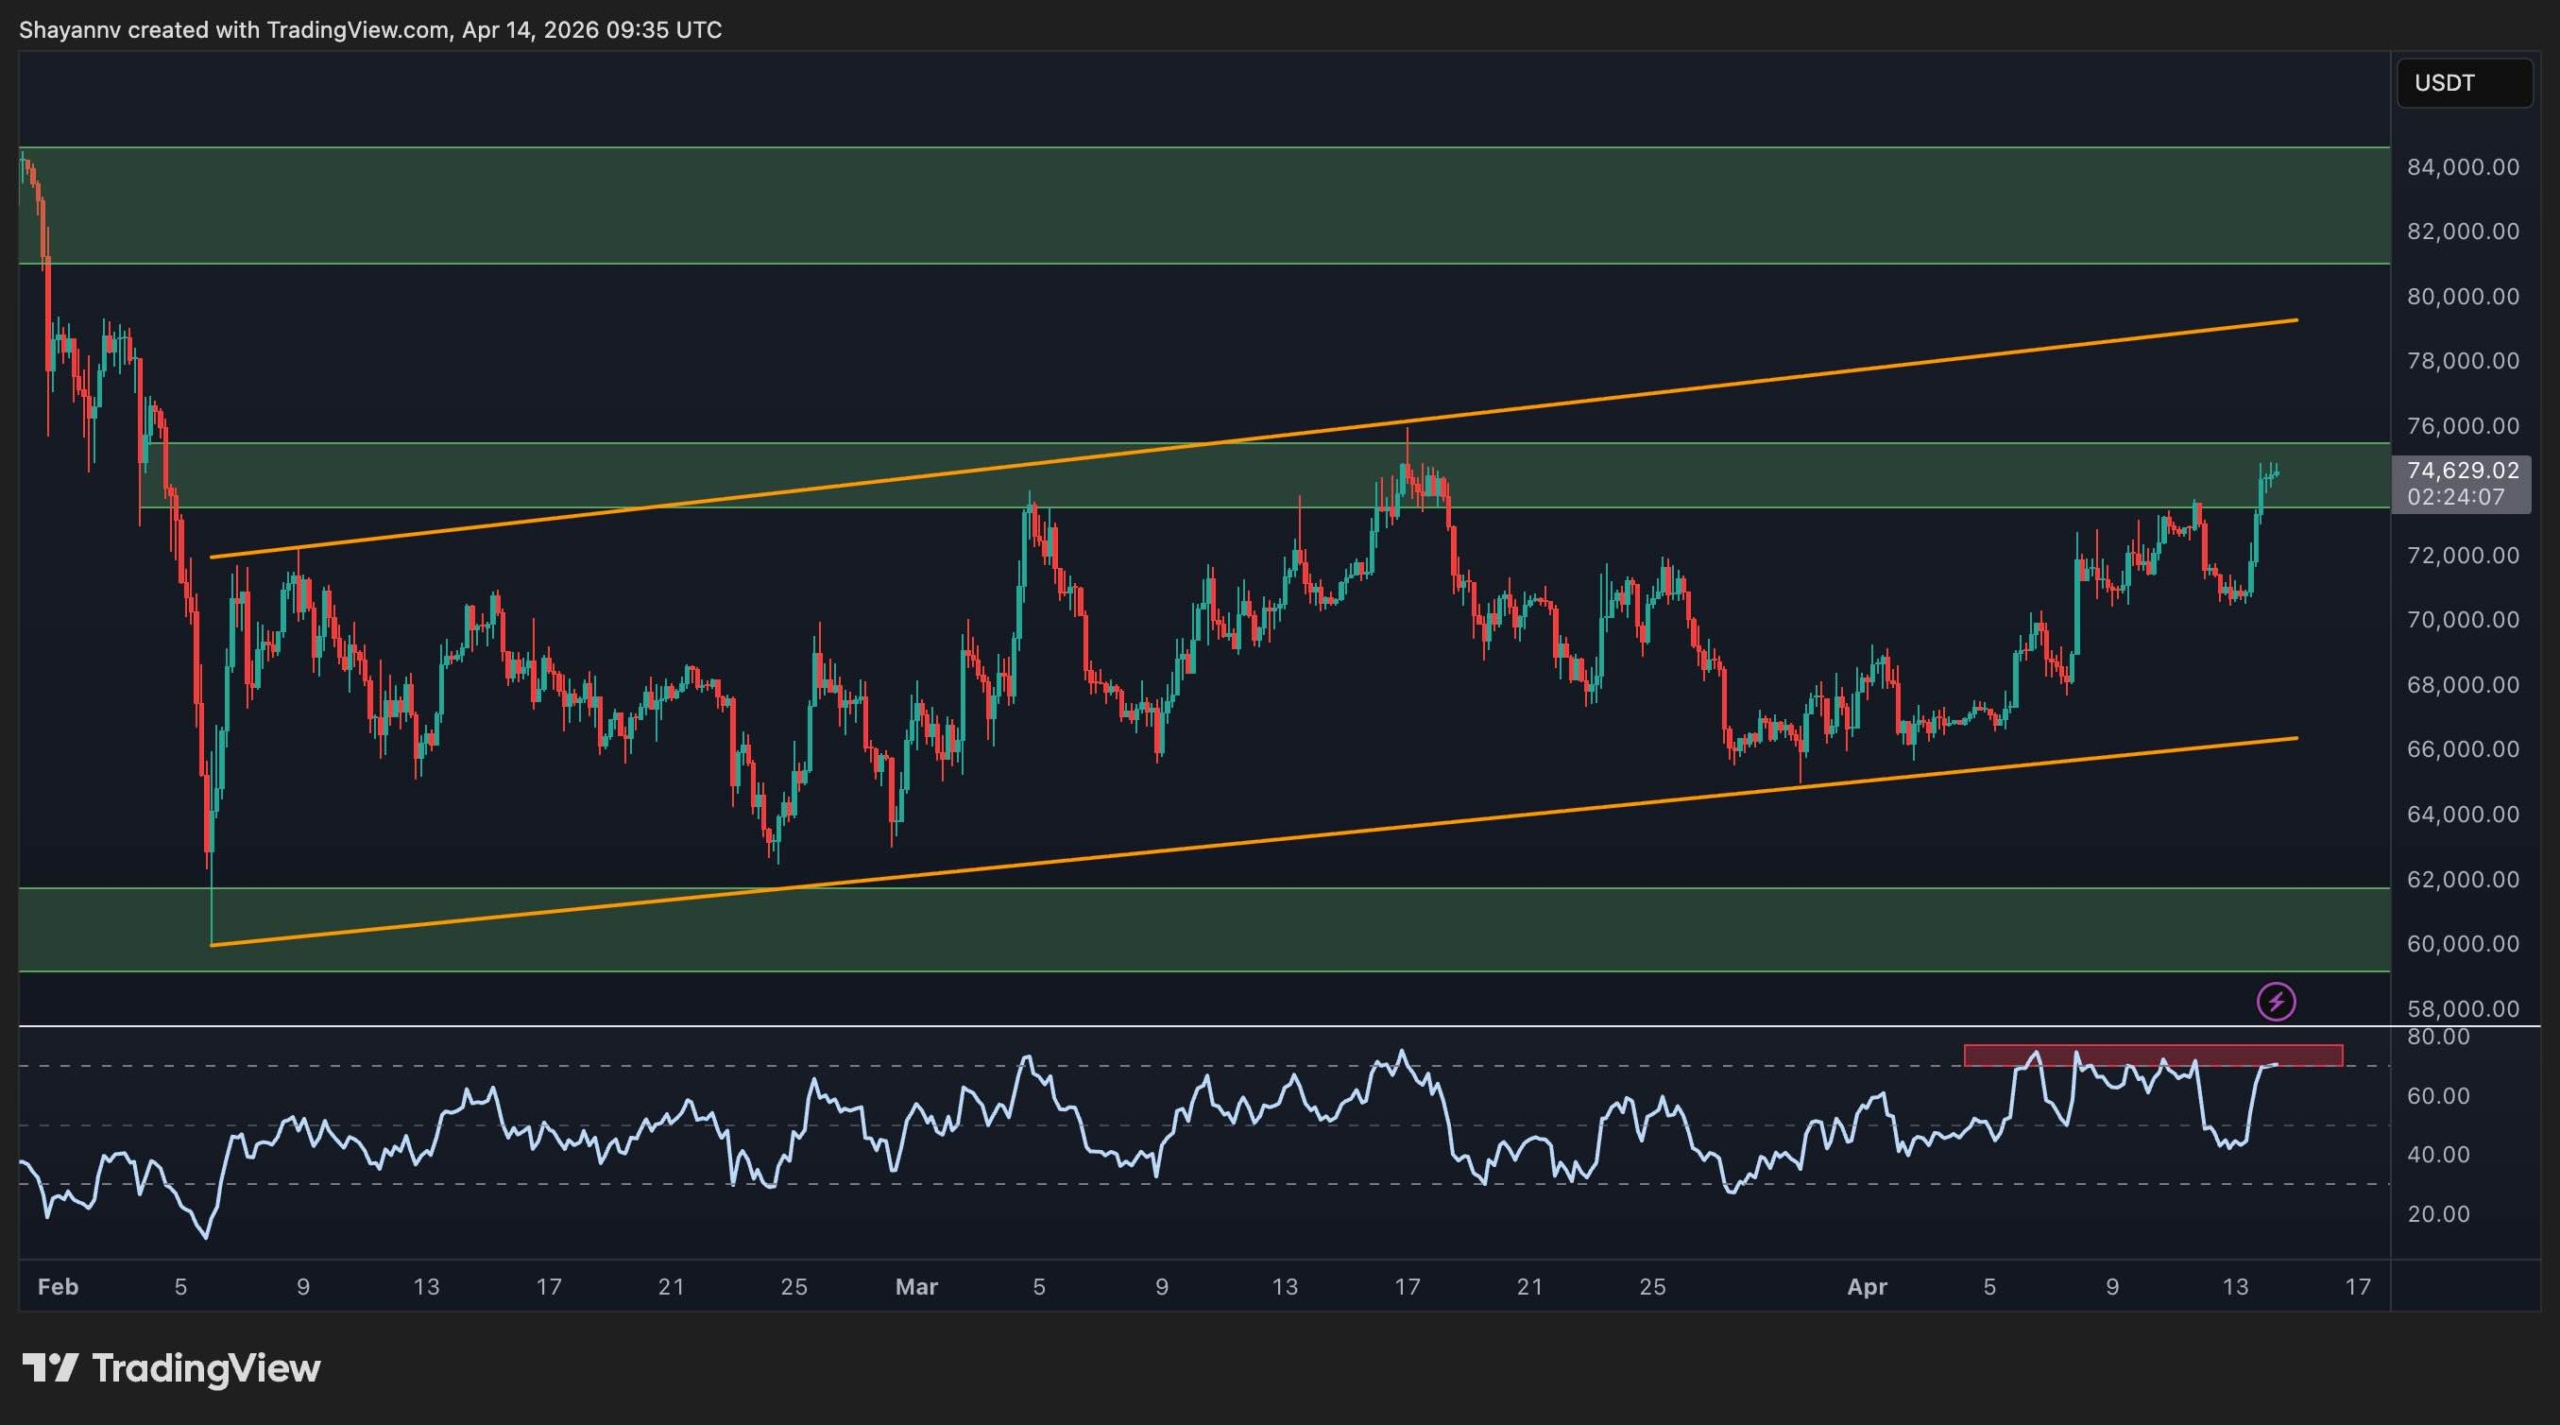
On the 4-hour chart, BTC has been trading inside a mildly ascending channel since the February lows. The price is now pushing toward the upper boundary of that channel near $80k. The move has brought BTC directly into the $74k–$76k resistance band, and the RSI has been persistently elevated near the overbought region over the last couple of weeks. This is reflected by the red highlighted zone on the RSI and suggests sustained bullish momentum, rather than a single spike.
The $74k-$76k area is the most important short-term hurdle to clear. A convincing close above it would open a path toward the $80k–$82k supply zone and would represent a meaningful shift in short-term structure. However, if the price stalls and pulls back from here instead, the channel’s lower boundary near $66k becomes the first support level to defend, with the key $60k zone as the deeper reference below.
Sentiment Analysis
Despite the recent price recovery toward $74.6k, Bitcoin’s funding rates across all exchanges remain deeply negative — currently reading around -0.015 — and have shown no meaningful recovery since the downtrend accelerated in February. The chart tells a stark story, which is that after over a year of predominantly positive funding throughout the 2025 bull market, the shift to persistent negative territory has been both sharp and sustained. The red bars have been dominating virtually every reading across the past two months.
What makes the current setup particularly notable is the disconnect between price and positioning. BTC has bounced meaningfully off the lows, yet futures traders are still overwhelmingly paying to hold short positions. This is a sign that the market remains deeply skeptical of the recovery’s durability.
This level of entrenched bearish positioning can cut both ways: on one hand, it reflects genuine conviction that prices will head lower; on the other, a heavily short-biased market is inherently vulnerable to a short squeeze if buyers step in with sufficient force above the $75k resistance level. Nevertheless, until funding rates normalize back toward zero and begin sustaining positive readings, the weight of futures market sentiment continues to lean against the bulls.

The post Bitcoin Price Analysis: What’s Next for BTC After Surge to $75K? appeared first on CryptoPotato.
Bitcoin is trading around $74.6k, posting one of its more meaningful recovery moves in recent weeks. The market is responding to improving geopolitical sentiment surrounding the US-Iran ceasefire negotiations. The broader downtrend has not been reversed yet, but the recent push is the closest BTC has come to challenging key structural resistance since the February BTC Analysis, Crypto News, Bitcoin (BTC) Price
This articles is written by : Nermeen Nabil Khear Abdelmalak
All rights reserved to : USAGOLDMIES . www.usagoldmines.com
You can Enjoy surfing our website categories and read more content in many fields you may like .
Why USAGoldMines ?
USAGoldMines is a comprehensive website offering the latest in financial, crypto, and technical news. With specialized sections for each category, it provides readers with up-to-date market insights, investment trends, and technological advancements, making it a valuable resource for investors and enthusiasts in the fast-paced financial world.