Bitcoin’s battle around the $60K region is entering a decisive phase after sellers are forcing a breakdown below this major support area. With momentum still favoring the sellers, traders are now watching whether demand can prevent a deeper correction toward the mid-$50K region.
Bitcoin Price Analysis: The Daily Chart
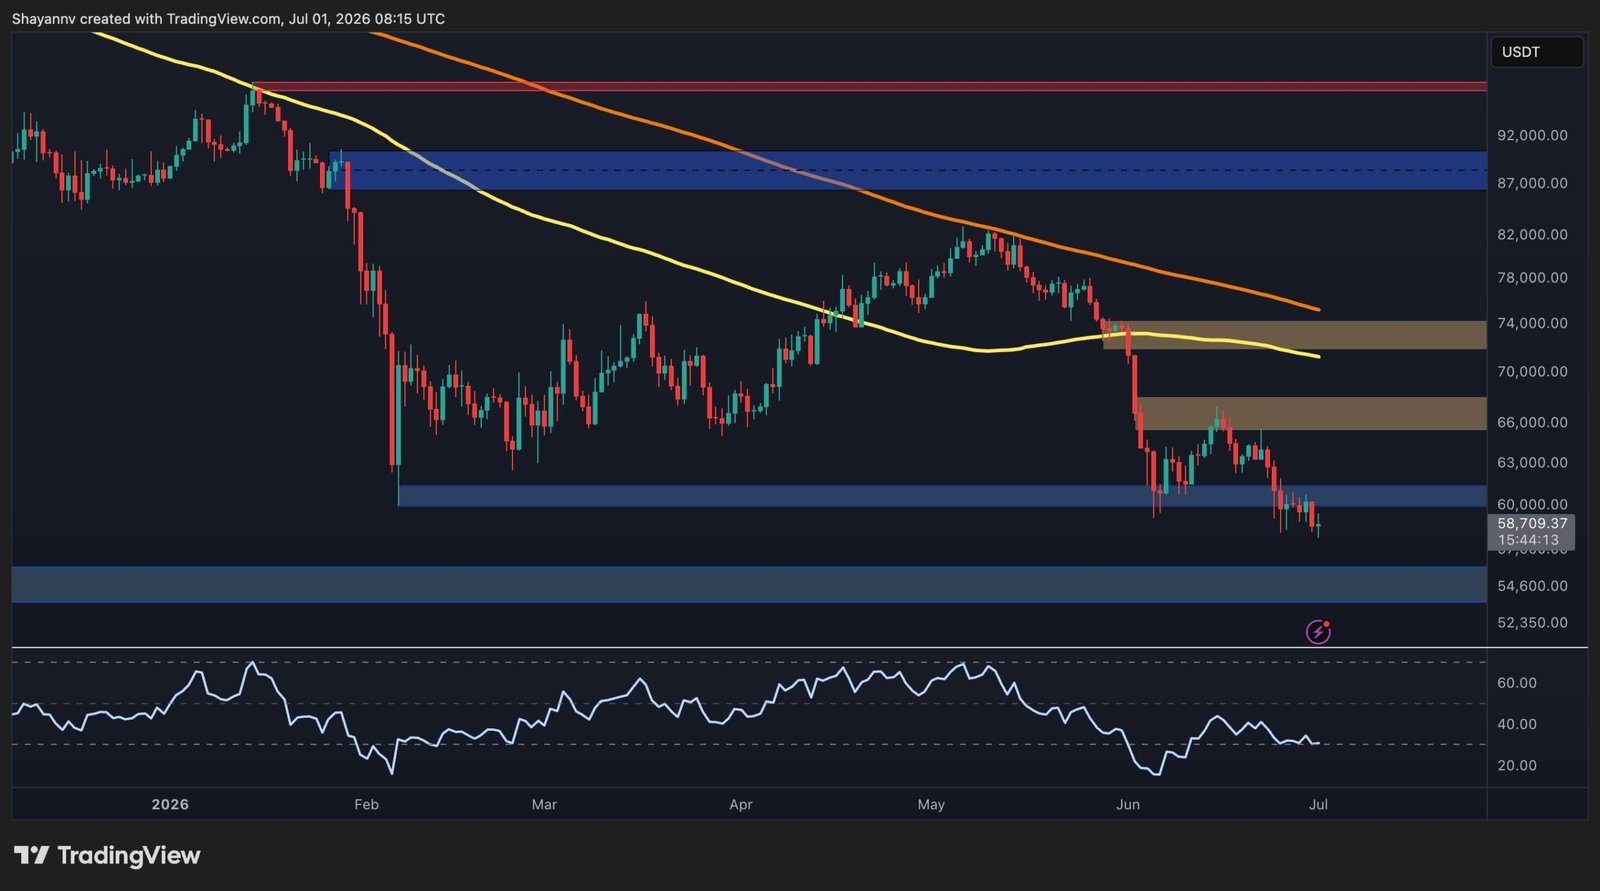
On the daily timeframe, BTC has extended its bearish trend after losing several major support zones. The recent rejection by the 200-day moving average around $80K and the breakdown of the 100-day moving average near $ 74 K have reinforced the longer-term downtrend, with both moving averages now sloping lower and acting as dynamic resistance.
The price is currently trading around $58.7K after breaking slightly below the $60K demand zone. This indicates that buyers have struggled to defend one of the market’s most important psychological levels. The next significant support lies around the $55K region, while a deeper correction could expose the broader demand area near $52K.
On the upside, Bitcoin would first need to reclaim the $60K level quickly before challenging the $66K to $68K resistance zone. Beyond that, the $72K to $74K area remains the primary barrier, as it coincides with the long-term moving averages. The broader bearish structure would only begin to improve if BTC manages to reclaim this region.

BTC/USDT 4-Hour Chart
The lower timeframe presents a similarly bearish picture. Bitcoin continues to trade inside a descending structure, respecting both the upper and lower boundaries throughout the recent decline. Every recovery attempt has produced another lower high, confirming that sellers remain in control.
The latest rejection from the $66K to $68K supply zone pushed BTC back toward the lower boundary of the channel. Price is now hovering around $58.7K, slightly beneath the $60K support area, increasing the probability of another test of lower liquidity and a breakdown of the channel structure.
Meanwhile, the RSI has formed a modest bullish divergence, with momentum making slightly higher lows while price printed fresh lows. Although this divergence could trigger a short-term relief bounce, it has yet to receive confirmation through a decisive breakout above nearby resistance.

On-Chain Analysis
Bitcoin’s Net Unrealized Profit/Loss (NUPL) has fallen sharply to approximately 0.09, placing the metric deep within the low-profit region shown on the chart.
NUPL measures the aggregate unrealized profit or loss held across the Bitcoin network. Higher readings generally reflect widespread investor optimism and elevated profitability, while lower values indicate shrinking profits and deteriorating market sentiment.
The current reading suggests that the majority of holders have seen a significant reduction in unrealized gains compared to previous months. Historically, such depressed NUPL levels have been associated with periods of capitulation or late-stage bear market conditions, when weak hands are gradually flushed out of the market.
While this does not guarantee an immediate reversal, it indicates that much of the speculative excess has already been removed. If selling pressure begins to ease and long-term investors continue accumulating, these historically depressed profitability levels could eventually provide the foundation for a broader recovery. Until price reclaims key resistance zones, however, the technical structure continues to favor the sellers.

The post Bitcoin Price Prediction: BTC Risks Drop Toward $55K After $60K Breakdown appeared first on CryptoPotato.
Bitcoin’s battle around the $60K region is entering a decisive phase after sellers are forcing a breakdown below this major support area. With momentum still favoring the sellers, traders are now watching whether demand can prevent a deeper correction toward the mid-$50K region. Bitcoin Price Analysis: The Daily Chart On the daily timeframe, BTC has BTC Analysis, Crypto News, Bitcoin (BTC) Price
This articles is written by : Nermeen Nabil Khear Abdelmalak
All rights reserved to : USAGOLDMIES . www.usagoldmines.com
You can Enjoy surfing our website categories and read more content in many fields you may like .
Why USAGoldMines ?
USAGoldMines is a comprehensive website offering the latest in financial, crypto, and technical news. With specialized sections for each category, it provides readers with up-to-date market insights, investment trends, and technological advancements, making it a valuable resource for investors and enthusiasts in the fast-paced financial world.