TLDR
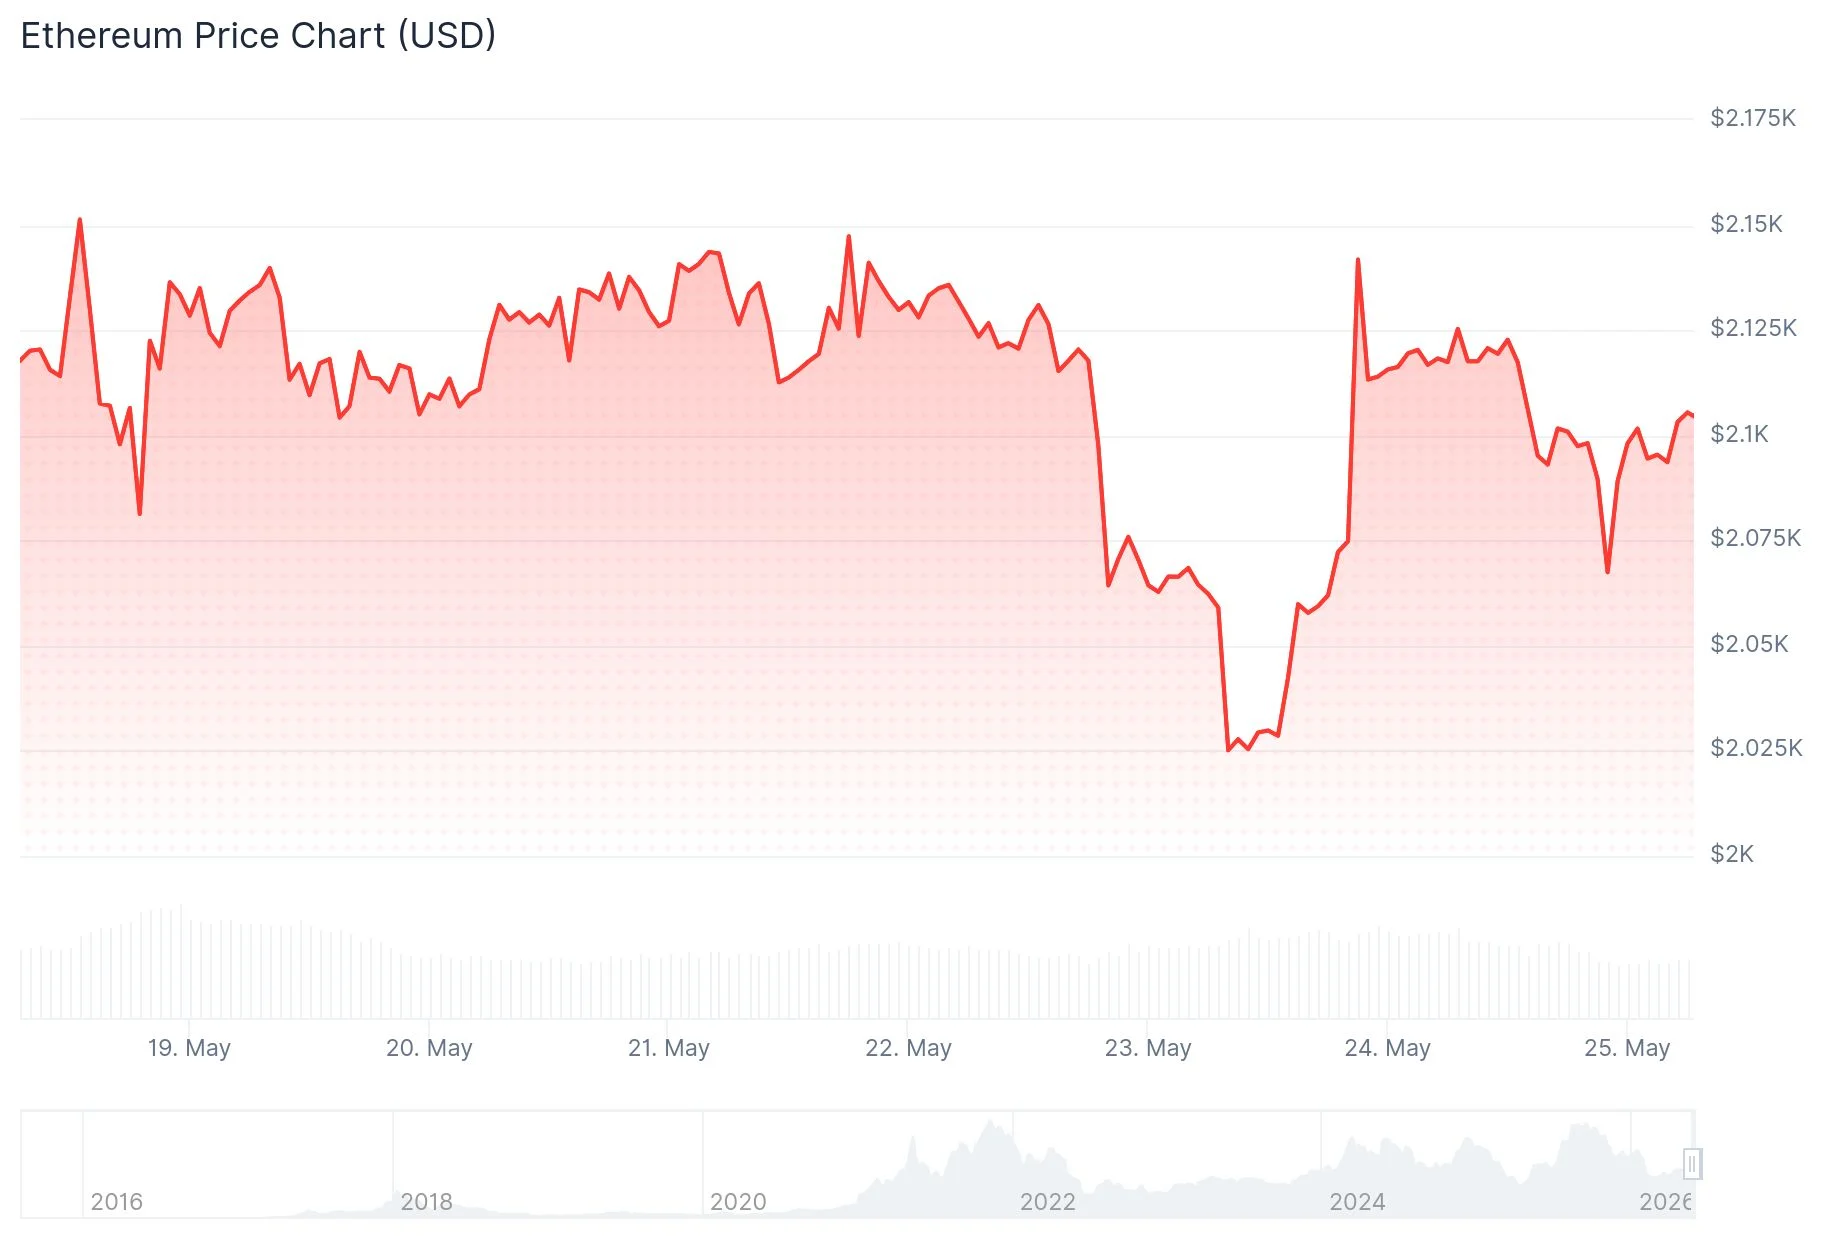
- Ethereum currently sits at $2,100 with a 1.34% daily increase but a 3.72% weekly decline
- Bulls successfully defended the $2,000 support zone but struggle to overcome $2,150 barrier
- Technical indicators show bearish momentum with RSI at 37.56 and MACD at -52.1
- Breaking through $2,150 resistance could catalyze a move to $2,220–$2,250
- Losing support at $2,065 may trigger a retest of the critical $2,000 level
Ethereum has stabilized near $2,100 following a modest daily uptick of 1.34%. The second-largest cryptocurrency by market capitalization continues to face weekly headwinds, showing a 3.72% decline over the past seven days. CoinMarketCap data places ETH’s market valuation at $253.63 billion.
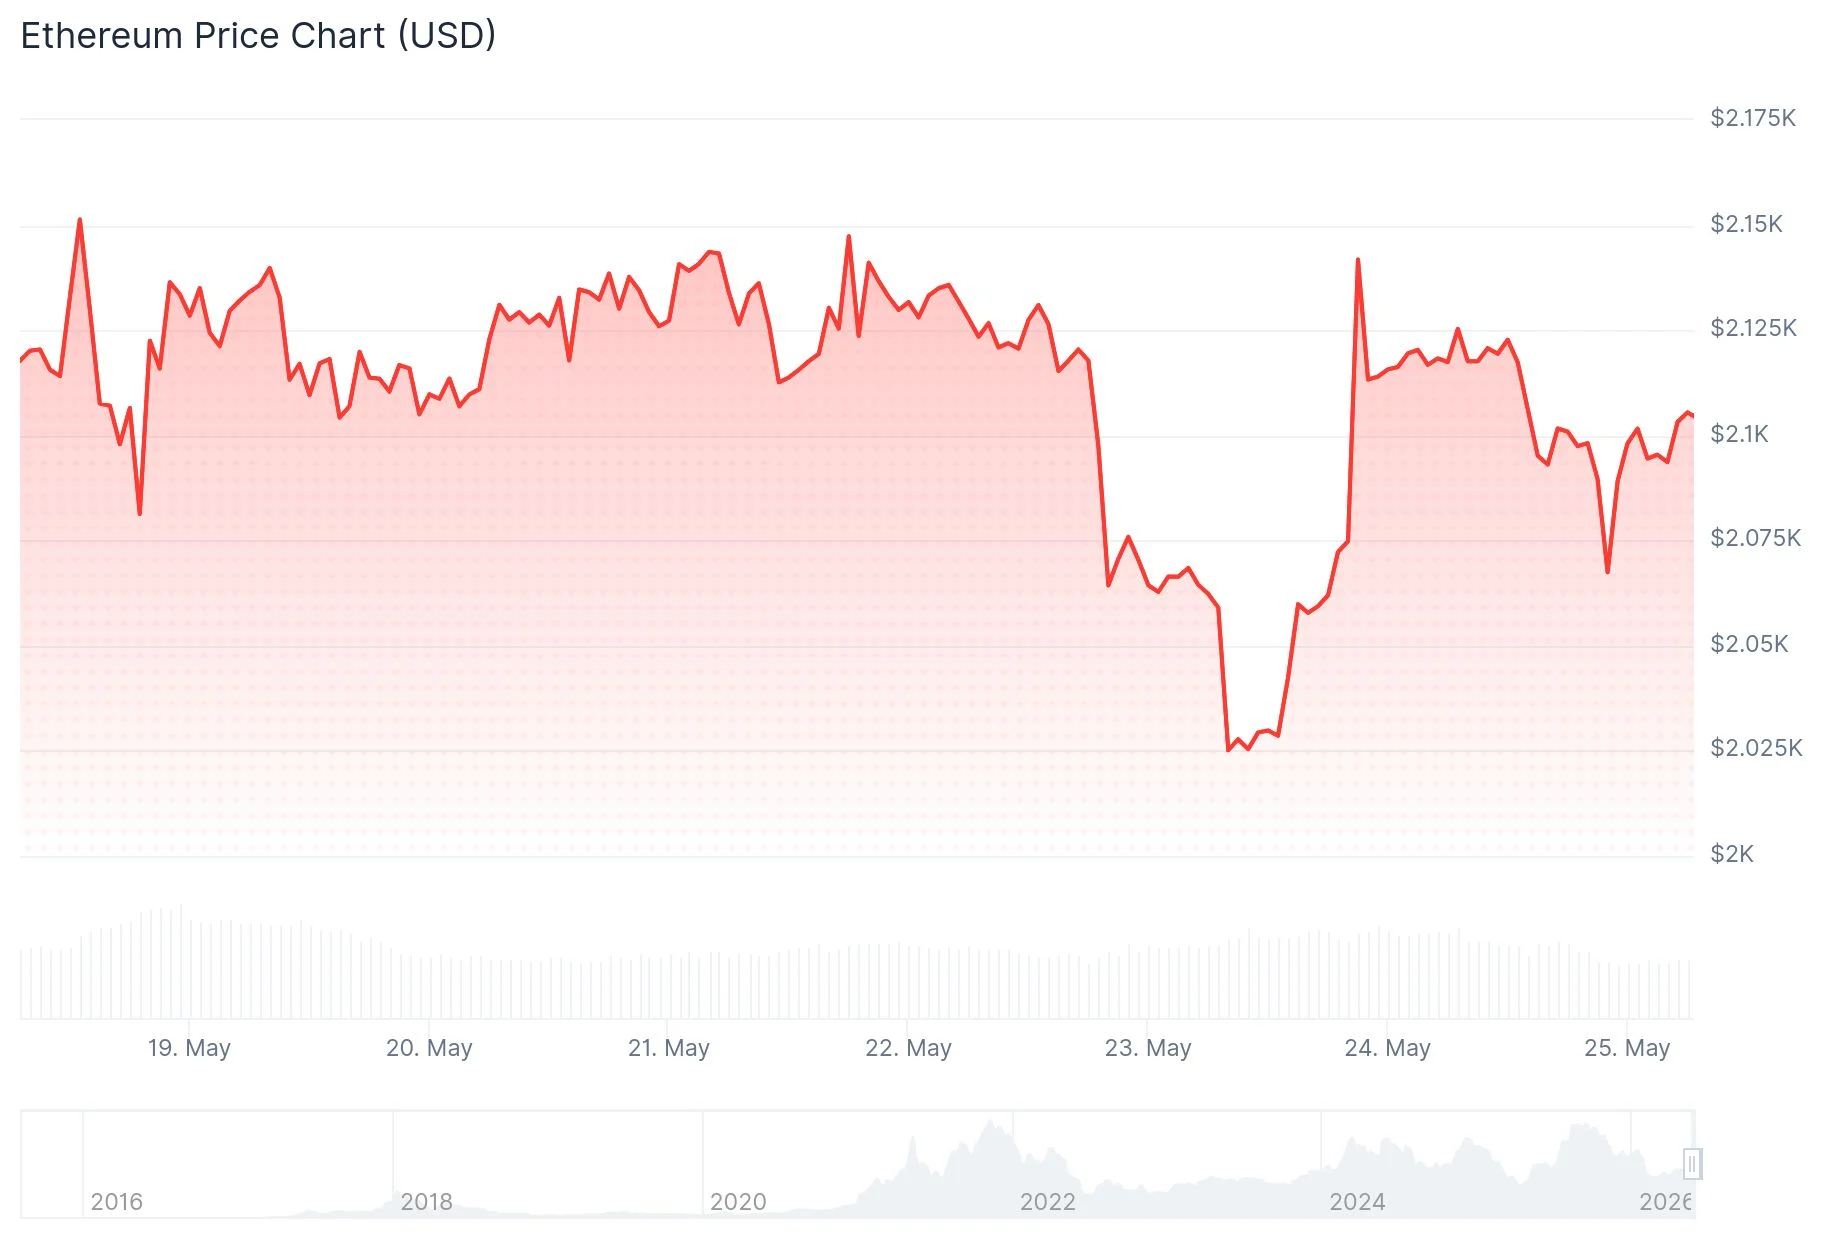
Recent price action reveals that ETH found solid footing at the psychologically significant $2,000 mark, suggesting accumulation activity in this region. Market observers point to this bounce as evidence of buyer participation, though upside momentum has stalled at the $2,150 threshold.
Crypto analyst TedPillows highlighted the importance of the recent $2,000 bounce, characterizing it as encouraging for the bullish case. However, he emphasized that the crucial challenge ahead involves breaking through the $2,150 barrier. Should ETH successfully clear this resistance, price action could extend toward $2,250. Conversely, rejection at current levels may result in another test of the $2,000 foundation.
Analyst Crypto Patel shared his perspective on X, identifying the $2,000–$1,400 corridor as a significant accumulation zone while highlighting $4,700 as the critical breakout threshold. His analysis projects an ambitious long-term trajectory with potential targets at $10K, $15K, and ultimately $20K. He emphasized: “The Smart Money Doesn’t Chase Green Candles. They Buy The Boring Range Nobody Talks About.” According to his assessment, Ethereum may be establishing one of the cycle’s most favorable entry opportunities.
Is $ETH Setting Up The Cleanest Long Of The Cycle?
The Roadmap Is Simple:
Buy Zone: $2,000 – $1,400 (Demand)
Resistance: $4,700 (Breakout Trigger)
Upside: $10K → $15K → $20K
Every Major ETH Rally Started From A Zone Just Like This.
The Smart Money Doesn’t Chase… pic.twitter.com/UGJwTibXda
— Crypto Patel (@CryptoPatel) May 25, 2026
Another market observer, The Boss, drew attention to Ethereum’s multi-year ascending support line, which has remained intact since 2022. ETH’s recent bounce from this technical structure reinforces its significance as a foundation for the broader bullish framework. He cautioned that maintaining position above this rising support channel is essential for preserving the long-term constructive outlook.
Technical Indicators Reflect Ongoing Selling Pressure
The Relative Strength Index currently registers 37.56, positioned below the neutral threshold of 50, while its moving average stands at 40.10. This configuration indicates that selling pressure continues to dominate, although ETH hasn’t yet reached oversold conditions.
The Moving Average Convergence Divergence displays a MACD line at -52.1, paired with a signal line at -35.9 and histogram value of -16.2. These readings reinforce the presence of persistent bearish momentum.
Short-term chart analysis reveals a developing bearish trend line on the hourly timeframe with resistance positioned around $2,110. Despite this, ETH maintains position above its 100-hour Simple Moving Average, providing a degree of immediate support.
Critical Price Zones Under Watch
Near-term resistance clusters at $2,110, $2,140, and $2,150. A decisive breakout above $2,150 would likely accelerate movement toward $2,220, followed by $2,250, with $2,320 representing the next major target.
For support levels, immediate defense sits at $2,075, with secondary support at $2,055 — corresponding to the 61.8% Fibonacci retracement level calculated from the swing low at $2,001 to the recent high of $2,147. Failure to maintain $2,055 could accelerate decline toward $2,020 or the critical $2,000 level. Below that, the primary support floor exists at $1,940.
Ethereum maintains its position above the 100-hour Simple Moving Average and continues defending the $2,065 level, which represents a crucial battleground for bulls attempting to sustain recovery momentum.
The post Ethereum (ETH) Eyes $20K Long-Term as Bulls Fight to Reclaim $2,150 Resistance appeared first on Blockonomi.
This articles is written by : Nermeen Nabil Khear Abdelmalak
All rights reserved to : USAGOLDMIES . www.usagoldmines.com
You can Enjoy surfing our website categories and read more content in many fields you may like .
Why USAGoldMines ?
USAGoldMines is a comprehensive website offering the latest in financial, crypto, and technical news. With specialized sections for each category, it provides readers with up-to-date market insights, investment trends, and technological advancements, making it a valuable resource for investors and enthusiasts in the fast-paced financial world.