Ethereum (ETH) price currently at $2,062.2 after a -0.35% move on March 26
Technical analysts predict potential five-digit ETH targets, with estimates ranging from $10,000 to $20,000
ETH shows a pattern of higher highs and higher lows, with key resistance levels at $2,100 and $2,166
Spot Ethereum ETF outflows have been reducing since February, potentially turning to inflows soon
Q1 2024 has been challenging for ETH with a 43% decline, contrasting with Bitcoin’s 23% gain
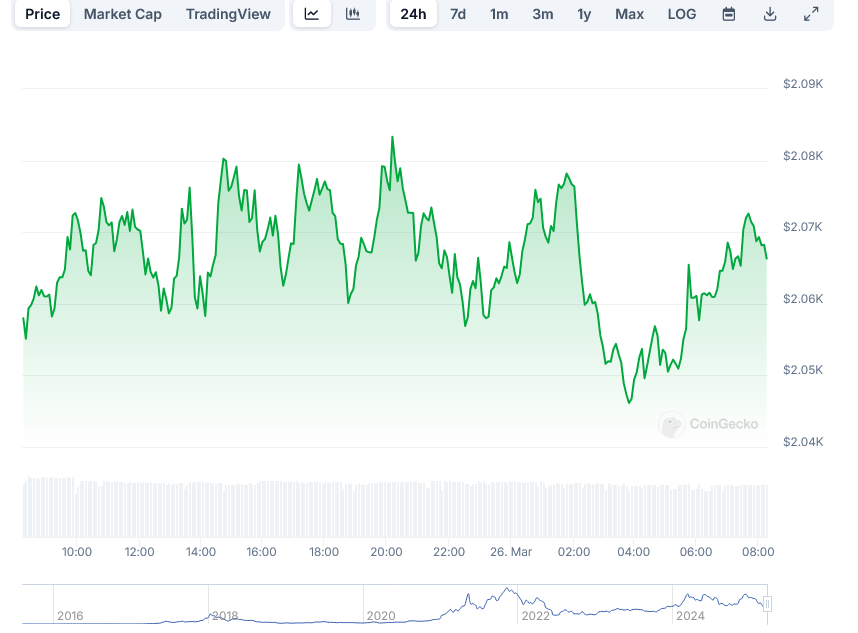
Ethereum (ETH) is trading at $2,062.20 as of March 26, showing a slight decline of 0.35% over the past 24 hours. Despite this small drop, multiple technical analysts are pointing to patterns suggesting that the second-largest cryptocurrency could be setting up for a major rally in the coming months.
The recent price action has been marked by consolidation, largely influenced by Bitcoin’s own sideways movement. ETH reached a daily high of $2,083.30 before settling at its current level.
Several crypto analysts have identified fractal patterns that hint at a potential five-digit price target for Ethereum. One analysis notes a “1, 2, 3 bounce pattern” similar to what occurred in 2017, 2018, and 2020, which previously led to a rally from $100 to $4,900.
If this pattern repeats, Ethereum could reach between $10,000 and $11,000. Another analyst has identified a declining broadening wedge pattern that suggests a possible target around $20,000.
The daily chart for ETH shows successive higher highs and higher lows, indicating buyers are trying to reverse the bearish trend. Key resistance levels at $2,100 and $2,166 need to be flipped into support to confirm a bullish trend.
If successful, ETH could attempt rallies of 20%, 28%, and 40% to reach resistance levels at $2,600, $2,770, and $3,000. As long as Ethereum forms a higher low above $1,934, the bullish trend remains intact.
Supporting these targets are CME gaps at $2,623, $2,888, $3,237, and $3,930. With continued buying pressure and Bitcoin’s macro bullish outlook, ETH could potentially reach $4,000 in April.
However, if Ethereum breaks below $2,134, it would suggest that selling pressure is dominant. In this case, ETH might revisit the $1,756 support level, with a breakdown potentially leading to a drop to $1,500.
Ethereum has formed a complex Inverse Head and Shoulder (iH&S) pattern on the weekly timeframe. This well-known bullish reversal structure often signals the end of a downtrend and the beginning of a new uptrend.
Market Analysis
According to analyst Gert van Lagen, this pattern suggests a possible price target of $18,000 for ETH. The left shoulder of this pattern formed from 2021 to 2022, with the head developing from 2022 to 2023 during the cycle low.
$ETH [1W] bounces off the ~$1800-$2000 support range while having formed a complex iH&S structure, targeting ~$18k.
This support level acted as resistance during the ‘head’ phase. Now price successfully retested it as support.
The right shoulder formed in 2024, creating a higher low that aligns with the left shoulder. The key level to watch is the neckline of this pattern at approximately $3,978, which acts as the primary resistance area.
If ETH can break above this resistance with strong volume, it could validate the pattern and open the door for the rally toward $18,000. A rejection at this level might lead to consolidation or a pullback to $1,888 before another attempt.
Despite these promising technical indicators, Ethereum has had a challenging start to 2024. It has recorded its second-worst performance in the first quarter of its history, with a 43% year-to-date decline.
This stands in stark contrast to Bitcoin’s 23% gain and XRP’s 279% surge during the same period. Market expert Lark Davis highlighted that ETH’s 38% drop in Q1 is approaching its worst quarterly performance of 46% recorded in Q1 2018.
$ETH experienced one of its worst Q1s in its entire history this year.
Historically, since 2016, ETH has averaged a 66% surge during the second quarter. If this trend continues, Ethereum could climb to $3,200 in the coming months, levels not seen since early February of this year.
Approximately $701 million worth of short positions will face liquidation if Ethereum’s price hits $2,114, according to CoinGlass data. These forced closings would require investors to buy back their positions, adding buying pressure to ETH’s outlook.
Spot Ethereum ETF outflows have been decreasing since February 26 and reached zero on Monday. If this trend continues, ETH ETFs might begin to see inflows, further boosting the positive outlook for the cryptocurrency.
For a sustainable rebound in the short term, Ethereum must overcome key resistance levels. While it has reclaimed its realized price of $2,040, the next challenge lies at the $2,300 mark, where strong resistance has been observed.
This articles is written by : Nermeen Nabil Khear Abdelmalak
All rights reserved to : USAGOLDMIES . www.usagoldmines.com
You can Enjoy surfing our website categories and read more content in many fields you may like .
Why USAGoldMines ?
USAGoldMines is a comprehensive website offering the latest in financial, crypto, and technical news. With specialized sections for each category, it provides readers with up-to-date market insights, investment trends, and technological advancements, making it a valuable resource for investors and enthusiasts in the fast-paced financial world.