TLDR
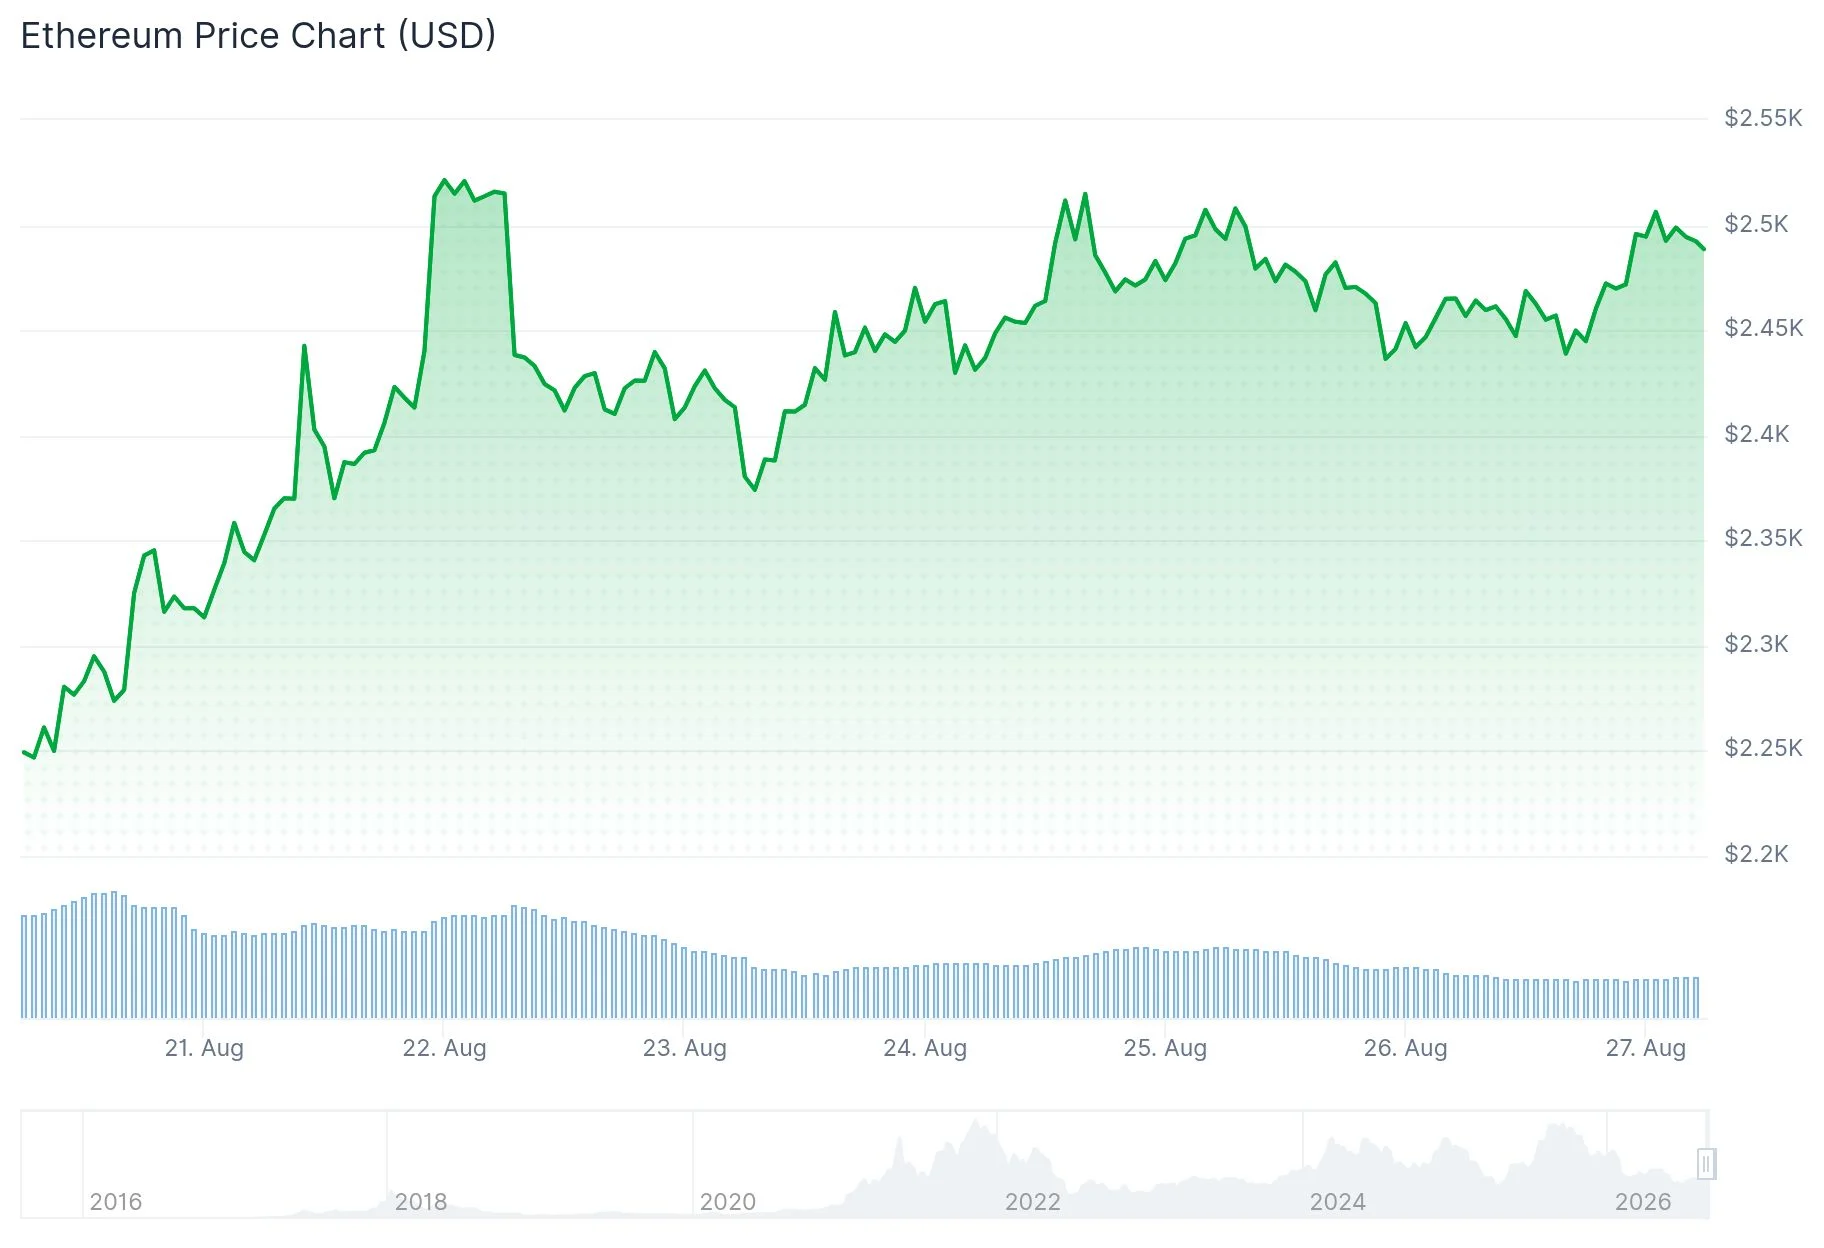
- ETH currently trades in the $2,450–$2,460 range following a robust 34% bounce from $1,900 support levels
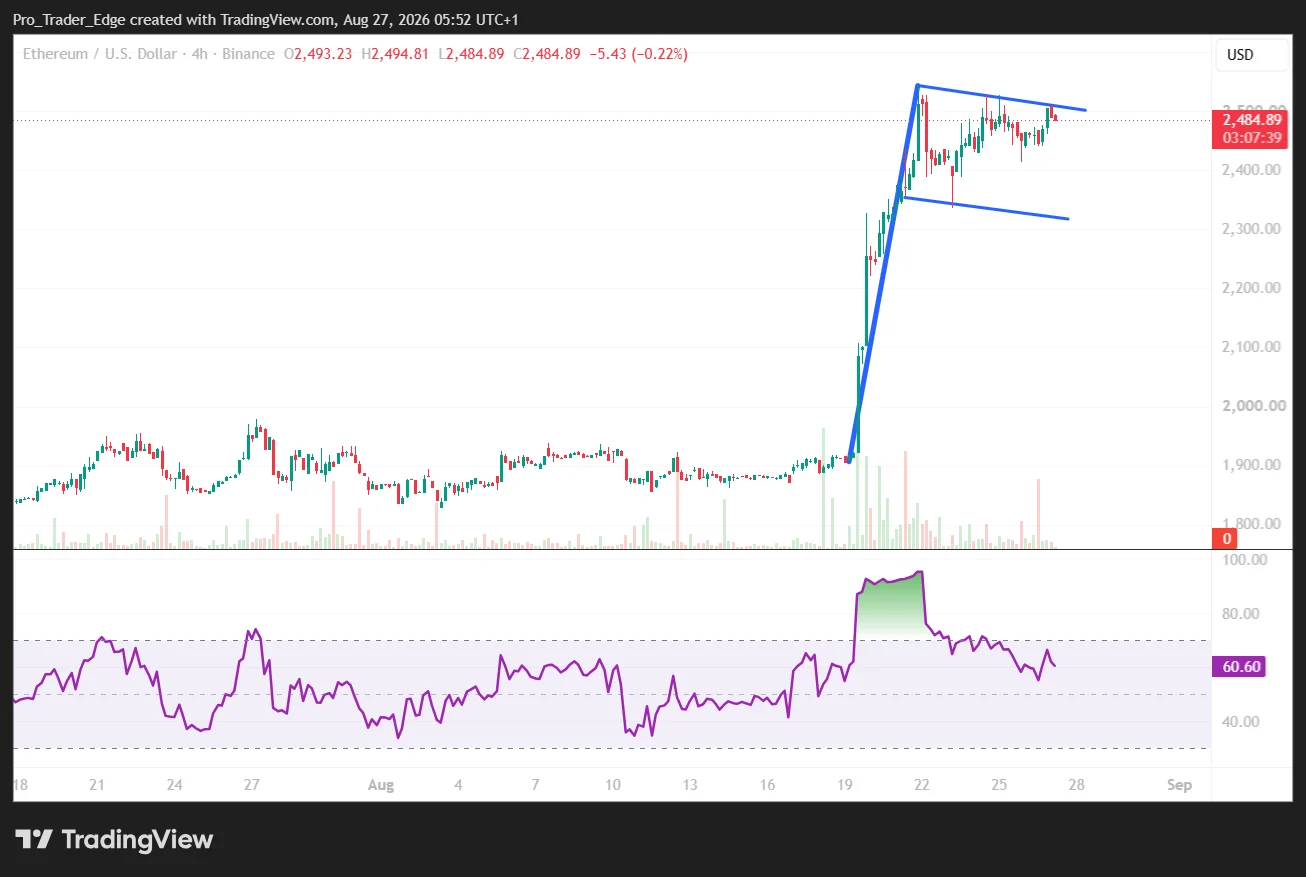
- Technical analysts identify a bull flag formation on 4-hour timeframe with critical resistance at $2,500–$2,550
- The daily RSI indicator reads 75.59, indicating strong overbought conditions
- On-chain data reveals significant whale resistance walls at $2,550 and $2,600, while support accumulates around $2,400
- Successfully closing above $2,400–$2,450 on the weekly chart may trigger a rally toward $2,823 and higher price targets
Ethereum has established a trading position around $2,450 following an impressive rebound from support levels near $1,900. The digital asset touched a weekly peak of $2,545.88 on August 21 before consolidating within a narrow band between $2,400 and $2,500.
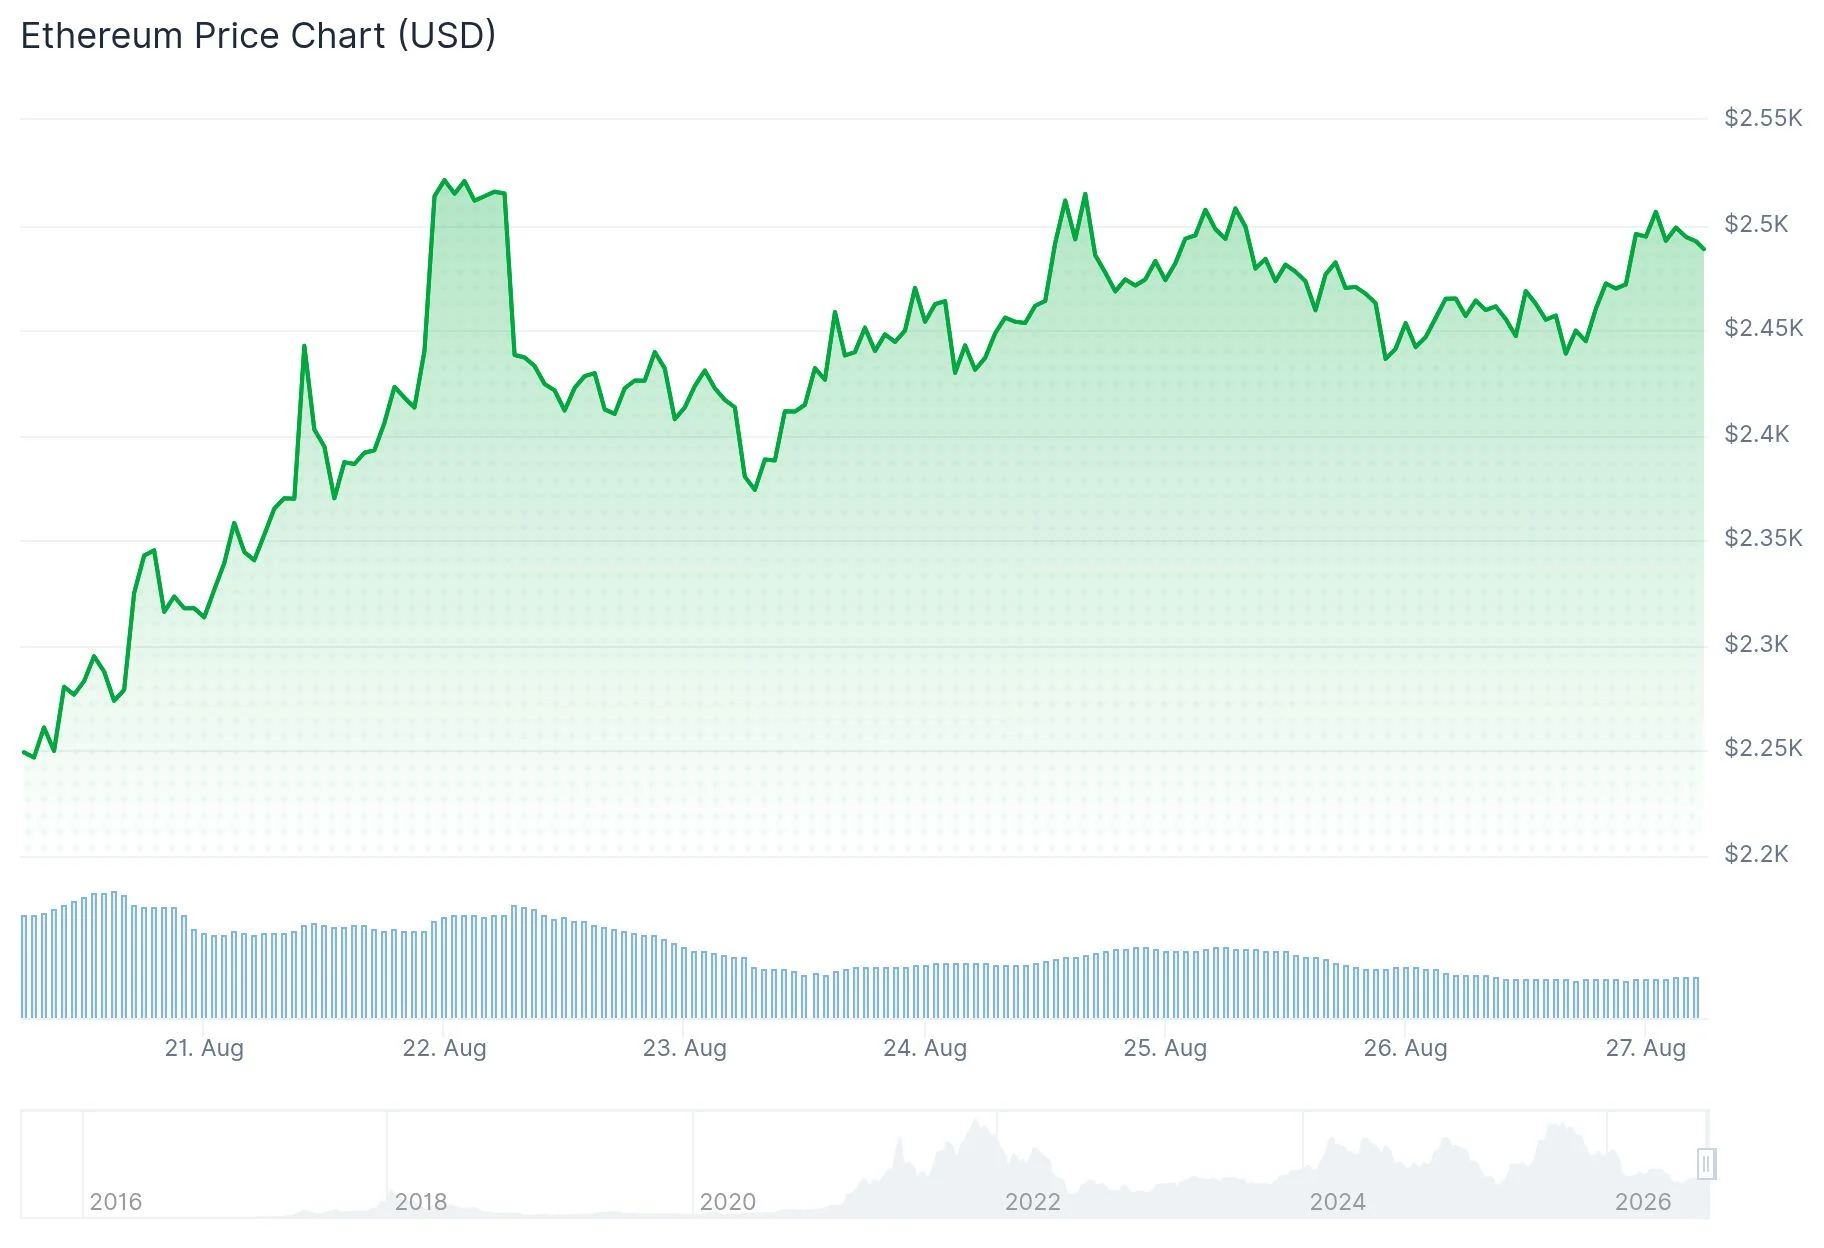
This rally from the $1,900 floor to the weekly high marked an impressive gain approaching 34%. Throughout much of August, ETH remained range-bound beneath $1,950 before decisively breaking through the $2,000 psychological barrier and advancing toward $2,500.
Market analyst Donald Dean observed that Ethereum successfully breached a descending trendline that had capped previous price action. The $2,400–$2,450 area, which previously served as resistance, is now transitioning into a support level—a development that technical analysts interpret as bullish.
Examining the 4-hour timeframe reveals Ethereum developing a textbook bull flag pattern—characterized by a downward-sloping consolidation range that follows a strong upward move. Breaking above the $2,510–$2,530 threshold would validate this pattern and potentially retest the $2,546 weekly high.
Market commentator Ted Pillows stated on August 26 that Ethereum requires a weekly candle close above $2,550 to establish a viable pathway toward the $3,000 milestone. According to his analysis, $2,550 represents the primary obstacle preventing the next significant upward movement.
Resistance and Supply Levels
Blockchain order book analysis reveals substantial whale-controlled sell orders concentrated at $2,550 and $2,600, establishing a notable supply barrier immediately above current trading levels. Meanwhile, significant buy-side liquidity accumulates near $2,400, providing technical reinforcement to that support zone.
CoinGlass liquidation metrics indicate the densest concentration of short position liquidations clustered around $2,530–$2,560. A price surge into this territory could trigger forced closures of bearish positions, potentially generating additional upward momentum.
Analyst Michaël van de Poppe commented on August 26 that an appealing entry opportunity for accumulating ETH during a pullback might be emerging, highlighting a demand zone that aligns closely with the $2,300–$2,400 support area.
Trader Daan Crypto Trades noted on X that ETH is maintaining its position above former resistance but cautioned that bullish participants must drive price to fresh local highs in the near term. He warned that failure to achieve this could trigger a reversal beneath resistance—a scenario he characterized as a possible “liquidity grab.”
Weekly Structure and Higher Targets
The weekly timeframe demonstrates Ethereum successfully recapturing the $2,300–$2,400 territory after recovering from depths near $1,500–$1,600. Analysts from Rand Group characterize this development as a significant higher-timeframe achievement.
A confirmed weekly close above $2,400 maintains the prospect of reaching $2,800 and $3,400. According to higher-timeframe structural analysis, the next clearly defined technical objective above current levels is $2,823.
Analyst Crypto Tony’s technical chart suggests a potential retest of the $2,420 level before initiating another advance toward $2,630–$2,650. Maintaining support at $2,420 would preserve the bullish structure necessary for that subsequent movement.
The daily Relative Strength Index currently registers 75.59, positioned above the conventional overbought threshold of 70. The Supertrend technical indicator identifies broader support at $2,158, approximately 14% beneath current price levels.
The post Ethereum (ETH) Price Eyes $3,000 Breakthrough as Key Weekly Close Approaches appeared first on Blockonomi.
This articles is written by : Nermeen Nabil Khear Abdelmalak
All rights reserved to : USAGOLDMIES . www.usagoldmines.com
You can Enjoy surfing our website categories and read more content in many fields you may like .
Why USAGoldMines ?
USAGoldMines is a comprehensive website offering the latest in financial, crypto, and technical news. With specialized sections for each category, it provides readers with up-to-date market insights, investment trends, and technological advancements, making it a valuable resource for investors and enthusiasts in the fast-paced financial world.