
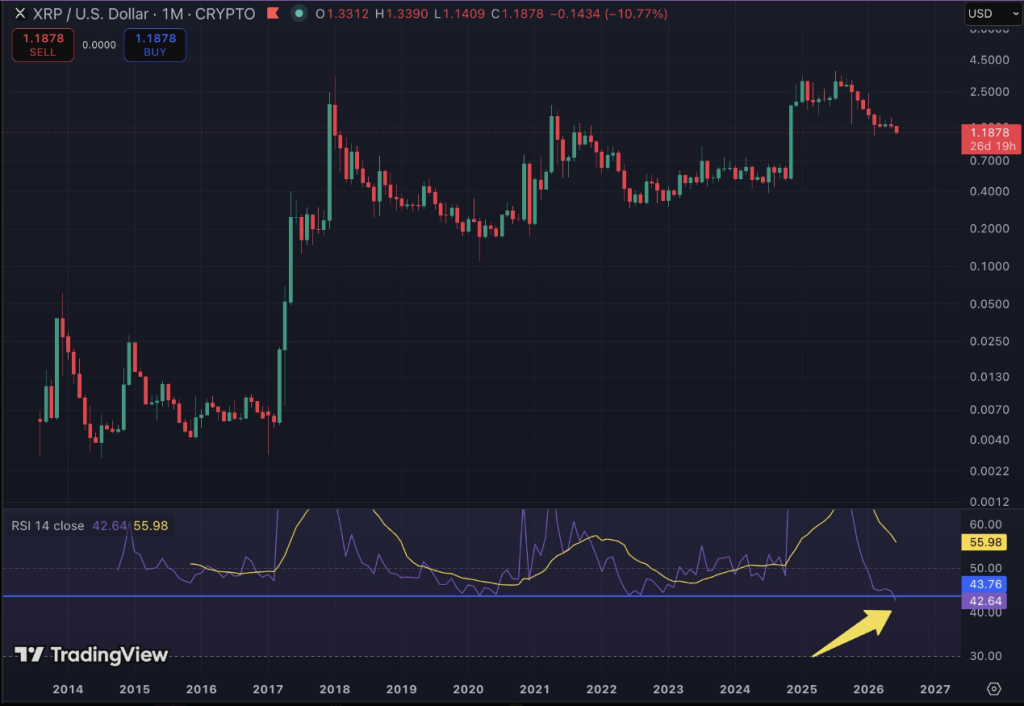
The XRP monthly relative strength index has fallen to 41.64, the lowest reading the indicator has ever recorded for the token — lower even than the 43.75 it hit in March 2020, when XRP bottomed out at $0.11 during one of crypto’s worst bear markets.
A Signal With A Caveat
The current reading edges out that 2020 low, but it is not yet final. June is still open, and data shows that if XRP recovers to above $1.30 before the month ends, the RSI could close well above its current level, which would undercut the significance of the signal entirely.
XRP market commentator Austin, who goes by that name in the XRP community, was the first to flag the RSI drop publicly. His initial chart showed the reading had fallen to 42.64 — itself a new all-time low at the time — as XRP slid to $1.18. Prices dropped further since then, pulling the RSI down to 41.62 at last check.
The token is currently trading around $1.11. That puts it roughly 61% below its October 2025 high of $2.84, a decline that has stretched across several months without a meaningful recovery.
XRP is the most oversold on the monthly time frame that it has EVER been. pic.twitter.com/xlKEQkK7tc
— Austin (@Austin_XRPL) June 4, 2026
What History Suggests
The 2020 episode offers a point of comparison, though it is only one. That year’s RSI bottom aligned with what turned out to be the price floor for XRP in that cycle.
From that low, the token posted a string of higher lows before reaching $1.96 in April 2021. A later surge in November 2024 pushed it as high as $3.40, representing a gain of roughly 580% from the October lows of that year.
The broader crypto market has also been under pressure this week. Bitcoin dropped toward the $63,000 mark after Strategy, the firm associated with Michael Saylor, confirmed it sold 32 BTC from its stash of more than 800,000 BTC. Total crypto market cap shed $330 billion in the span of a week.
XRP’s Own Decline In Focus
XRP’s market cap dropped from $82.5 billion at the start of this week to around $69 billion at the time of writing, a fall of roughly 15%. Reports note that the current price of $1.10 revisits levels last seen in early February.
RSI measures the speed and size of recent price changes, and a reading below 30 is traditionally considered oversold territory.
XRP’s monthly reading at 41.64 sits above that threshold, though it represents a historically low level for the token specifically.
Whether the June candle closes anywhere near its current RSI reading will determine whether the signal holds.
Featured image from Pexels, chart from TradingView
This articles is written by : Nermeen Nabil Khear Abdelmalak
All rights reserved to : USAGOLDMIES . www.usagoldmines.com
You can Enjoy surfing our website categories and read more content in many fields you may like .
Why USAGoldMines ?
USAGoldMines is a comprehensive website offering the latest in financial, crypto, and technical news. With specialized sections for each category, it provides readers with up-to-date market insights, investment trends, and technological advancements, making it a valuable resource for investors and enthusiasts in the fast-paced financial world.