TLDR:
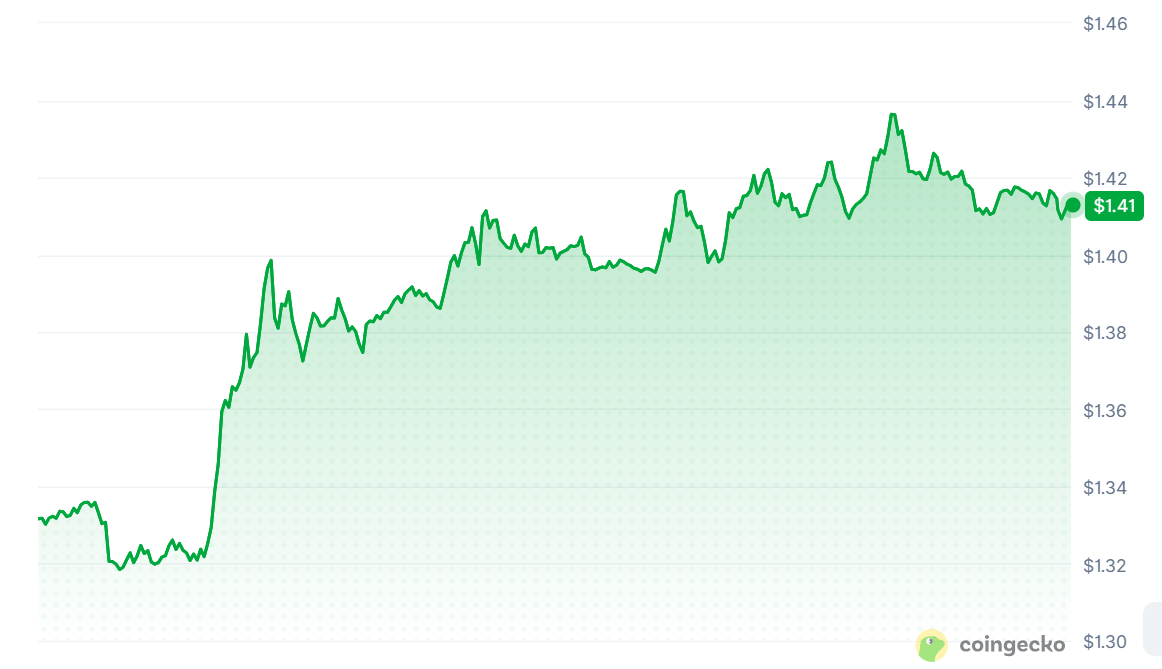
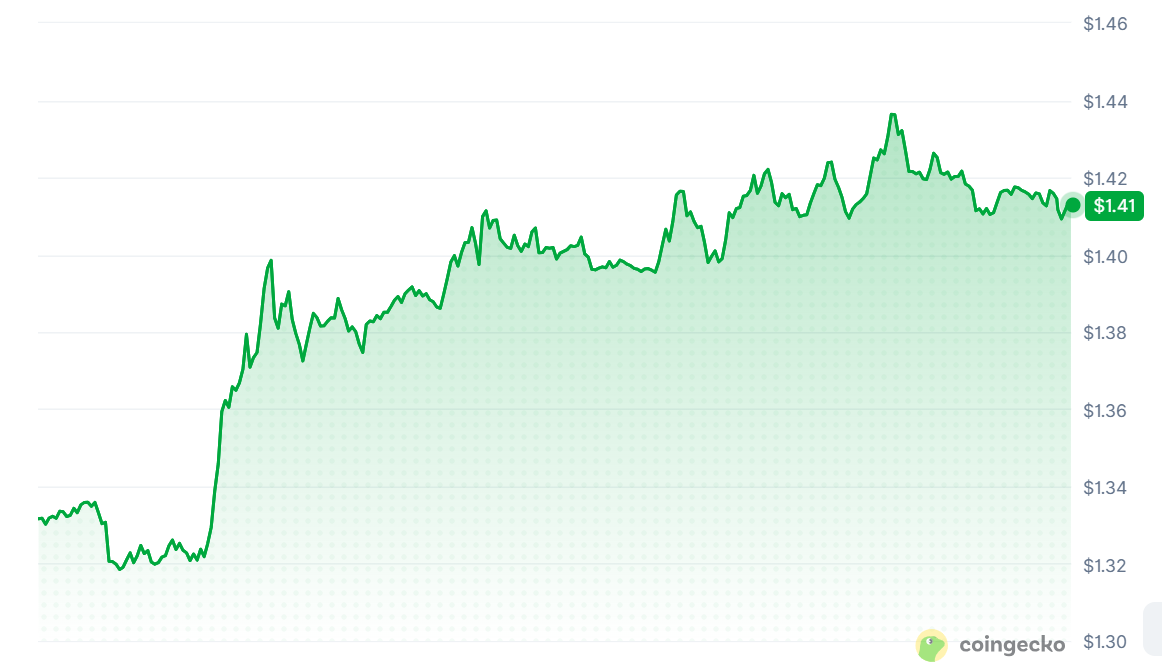
- XRP price trades at $1.41 today, up 6.25% over 24 hours, with $4.31 billion in trading volume, CoinGecko shows.
- XRP still has not reclaimed its monthly 21 EMA, the key level analysts are tracking for bullish momentum.
- A monthly close above $1.63 to $1.65 plus the falling wedge break would confirm a stronger bullish setup.
- Losing the monthly 50 EMA lifts the odds of XRP returning to the 100 EMA, last cycle’s macro bottom zone.
The XRP price is trading near $1.41 after a 6.25% daily gain, with volume above $4.31 billion. CoinGecko data also shows XRP has gained 3.30% over the past seven days.
The move has placed XRP near a technical decision zone highlighted by several market analysts. EGRAG Crypto says confirmation remains essential before treating the broader monthly structure as bullish.
On the monthly chart, EGRAG identifies the 21 EMA, 50 EMA and 100 EMA as key trend levels. The 21 EMA remains unreclaimed, while the 50 EMA continues holding price.
XRP Price Faces Multiple Technical Resistance Levels
The 100 EMA previously acted as a macro bottom. EGRAG notes XRP revisited that average three times during the previous cycle. The current cycle has recorded one such touch so far.
This framework matters because moving averages can separate short-term momentum from longer-term market structure. They do not predict outcomes alone. Instead, traders use them to monitor where trend probabilities may change.
XRP price is also testing a structure that could determine its next major move. ChartNerd says XRP has broken from descending resistance and moved through the 0.382 Fibonacci level.
$XRP is breaking out of its descending resistance structure and pushing through the key 0.382 FIB level, but the real test lies ahead
Price now faces two major zones between $1.45 and $1.51, the 0.5 and 0.618 FIB pockets, which have historically acted as strong decision… https://t.co/ze8qn2oJw2 pic.twitter.com/0qqCLJeMjt
—
ChartNerd
(@ChartNerdTA) September 19, 2026

The analyst places the next major Fibonacci zones between $1.45 and $1.51. These represent the 0.5 and 0.618 retracement levels, respectively.
The 50-week EMA near $1.51 adds another technical reference to that resistance area. A sustained move through this zone would provide stronger confirmation for traders watching continuation.
Failure around those levels would leave XRP exposed to a return toward its recent range. That would keep the broader breakout setup unresolved.
What Could Confirm the Next XRP Price Move?
For investors, the distinction between a breakout and confirmation is important. A single move above resistance can fail if buyers cannot sustain higher-timeframe closes.
EGRAG’s framework requires three conditions before the bullish setup gains stronger confirmation. These include a monthly close above the 21 EMA, a falling-wedge breakout, and a 0.382 Fibonacci reclaim.
#XRP – Technical Analysis Is Probability, Not Certainty
:
NOTE: Technical analysis is not about predicting the future with certainty because:
Markets are chaotic
The job is to identify the levels where probabilities begin to shift.
And… pic.twitter.com/5g6xpgBLDc
— EGRAG CRYPTO (@egragcrypto) September 19, 2026
The 0.382 Fibonacci level sits around $1.63 to $1.65 on EGRAG’s monthly analysis. That zone therefore becomes another important reference beyond the nearer $1.45 to $1.51 resistance.
Crypto Patel uses broader levels, identifying $1.70 and $3 as major resistance zones. The analyst also identifies $1 and $0.60 as major support levels.
The current price action therefore leaves XRP between several important technical thresholds. Traders can monitor whether price converts resistance into support through sustained higher-timeframe closes.
On the downside, confirmed higher-timeframe closes below the 50 EMA would change the technical picture. EGRAG says that could increase the probability of another 100 EMA retest.
The key mechanism is confirmation across several independent technical levels. XRP price strength above moving averages, Fibonacci resistance, and chart structure would strengthen the breakout case.
The post XRP Price Breakout Faces $1.45-$1.51 Resistance: What Comes Next? appeared first on Blockonomi.
This articles is written by : Nermeen Nabil Khear Abdelmalak
All rights reserved to : USAGOLDMIES . www.usagoldmines.com
You can Enjoy surfing our website categories and read more content in many fields you may like .
Why USAGoldMines ?
USAGoldMines is a comprehensive website offering the latest in financial, crypto, and technical news. With specialized sections for each category, it provides readers with up-to-date market insights, investment trends, and technological advancements, making it a valuable resource for investors and enthusiasts in the fast-paced financial world.