
Key Takeaways
- XRP is currently trading between $1.43 and $1.45, showing a 1.2% increase over the past day
- Critical resistance zone identified at $1.44–$1.50, while support maintains around $1.35
- Technical analysts have spotted a Gartley harmonic formation with a price objective of $2.64
- A symmetrical triangle pattern is forming on the daily timeframe, suggesting an imminent volatility expansion
- Market analyst EGRAG CRYPTO identifies $2.30 as the first breakout target following resistance clearance
XRP continues to trade within a tight consolidation zone as multiple technical formations converge, drawing increased attention from market analysts anticipating a decisive price movement.
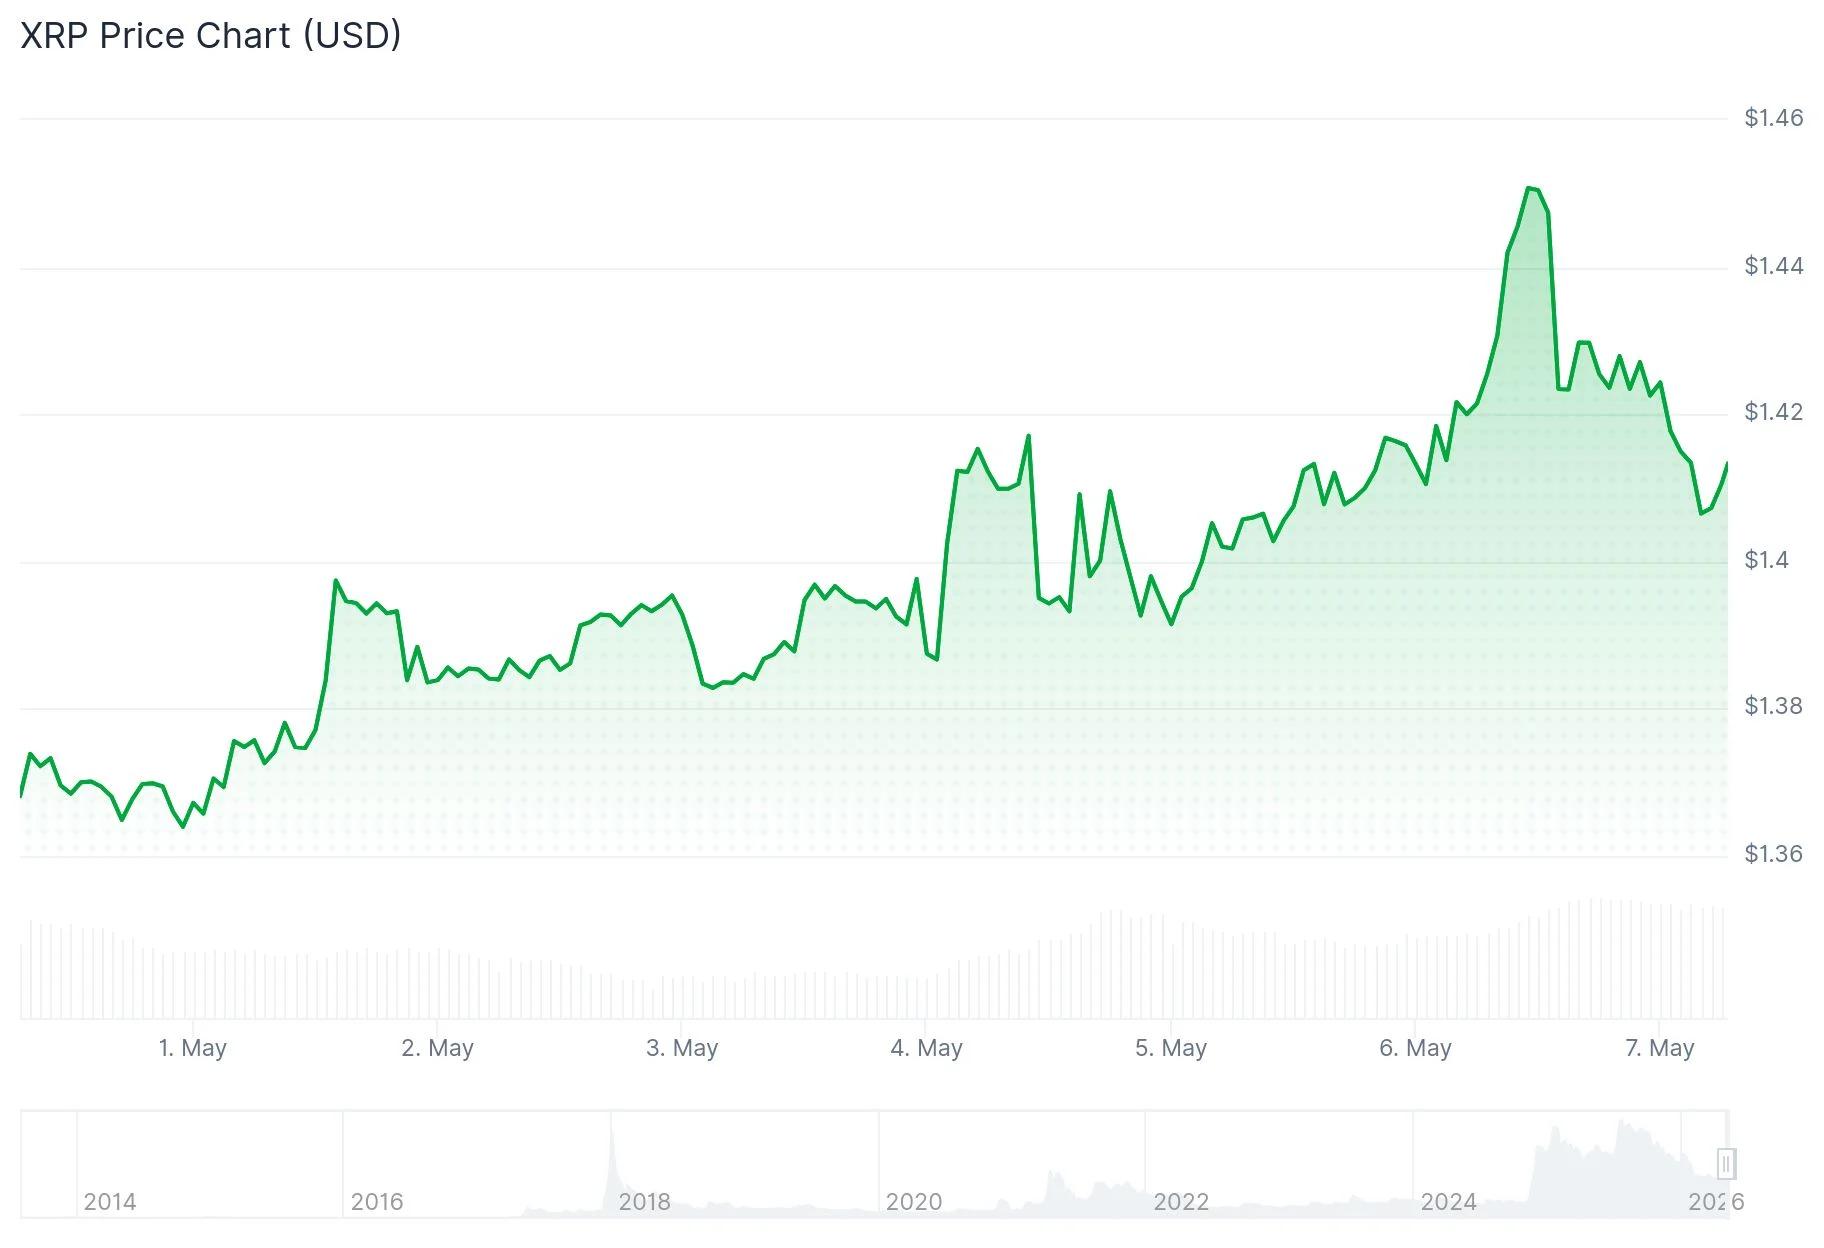
The digital asset, recognized for facilitating efficient cross-border transactions with minimal fees and rapid settlement times, is presently fluctuating between $1.43 and $1.45. While the token has registered a modest 1.2% gain in the previous 24-hour period, the developing technical patterns on its charts are capturing significant market interest.
Price action has maintained stability above the middle Bollinger Band on the daily timeframe. This level has functioned as reliable dynamic support, maintaining bullish market structure for the time being. The upper Bollinger Band, positioned around $1.46–$1.47, represents the next immediate resistance hurdle.
The MACD indicator shows gradual momentum accumulation. Although a definitive breakout confirmation has yet to materialize, preliminary indications of a potential bullish crossover are emerging. Current trading volume remains at moderate levels, which technical analysts often interpret as accumulation behavior rather than distribution activity.
Harmonic Formation Points to Substantial Upside
Chart analyst The_Alchemist_Trader_ has highlighted a Gartley harmonic pattern forming on XRP’s price chart. This pattern is approaching its final C-D completion phase, and if the structure plays out according to technical projections, it could drive prices toward approximately $2.64. The analyst emphasized: “The harmonic structure is approaching its final phase, and holding the current support zone is critical for continuation.” Any breach below the established support zone would completely invalidate this technical formation.
In a separate analysis, EGRAG CRYPTO highlighted a narrowing symmetrical triangle pattern visible on the daily chart. Such formations typically precede significant price movements in either direction. EGRAG CRYPTO observed that this configuration “could lead to a strong breakout once macro resistance levels are cleared,” establishing an initial price objective around $2.30. However, traders should remain aware of potential false breakout scenarios, where price could briefly surge before reversing.
#XRP – TICK-TOCK… TIME IS RUNNING OUT
The symmetrical triangle on #XRP is becoming impossible to ignore. Price keeps compressing tighter and tighter, and historically this type of structure always leads to a violent expansion move. The measured targets are becoming crystal… pic.twitter.com/MwZh5njHNC
— EGRAG CRYPTO (@egragcrypto) May 6, 2026

Critical Price Zones Under Observation
The $1.44–$1.50 area has repeatedly functioned as a supply zone throughout recent trading sessions. A decisive daily close above this threshold would likely clear the path toward $1.60 initially, with higher targets becoming viable thereafter. Conversely, the $1.35 level represents crucial support. A breakdown beneath this floor could trigger further downside movement toward $1.32.
The Relative Strength Index currently registers near 57 — positioned in neutral territory, neither indicating overbought nor oversold conditions. Shorter-period moving averages display bullish alignment, while broader oscillator readings remain balanced. The daily chart exhibits a “Change of Character” formation, which typically signals a potential trend shift without yet confirming the ultimate direction.
From a fundamental perspective, Ripple has been releasing announcements regarding expanded participation in tokenized asset initiatives and institutional adoption of cross-border settlement solutions utilizing the XRP Ledger. While these developments bolster longer-term market confidence, they are generally not catalysts for immediate price volatility.
As of this writing, XRP is valued at approximately $1.45, positioned just beneath the significant $1.46–$1.47 resistance band.
The post XRP (XRP) Price: Technical Patterns Signal Potential Rally to $2.64 appeared first on Blockonomi.
This articles is written by : Nermeen Nabil Khear Abdelmalak
All rights reserved to : USAGOLDMIES . www.usagoldmines.com
You can Enjoy surfing our website categories and read more content in many fields you may like .
Why USAGoldMines ?
USAGoldMines is a comprehensive website offering the latest in financial, crypto, and technical news. With specialized sections for each category, it provides readers with up-to-date market insights, investment trends, and technological advancements, making it a valuable resource for investors and enthusiasts in the fast-paced financial world.