Bitcoin’s Lightning Network is handling more payment value than ever. Some of its best-known infrastructure numbers, such as node and channel counts, are below earlier peaks.
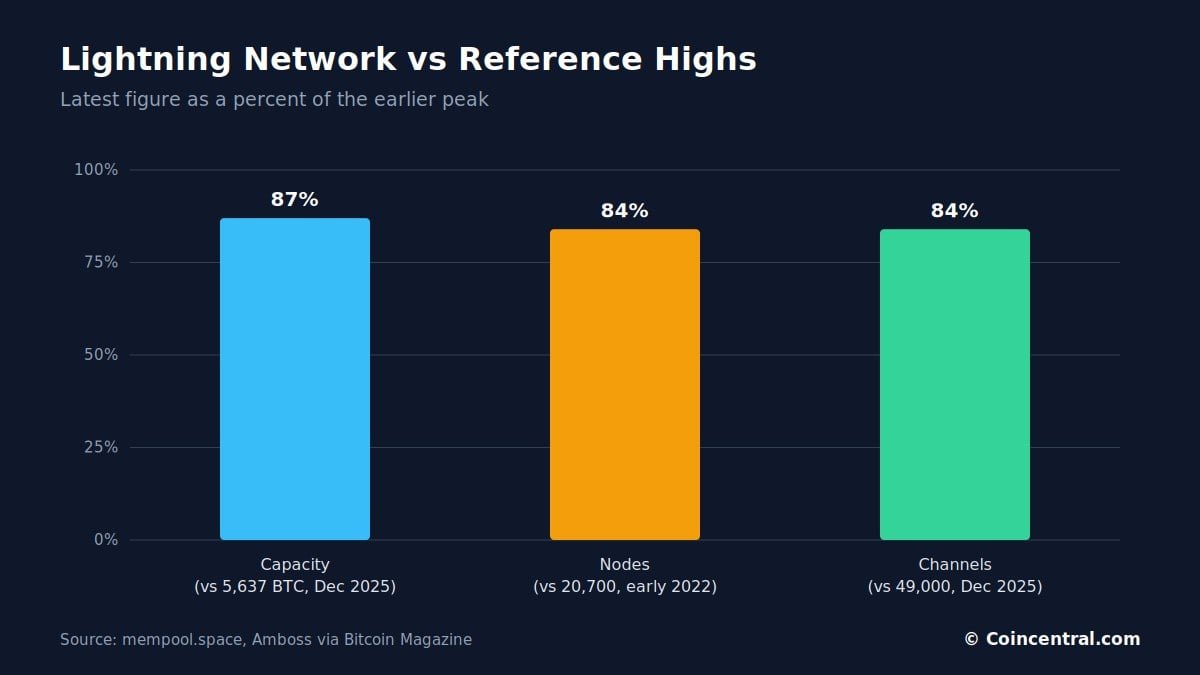
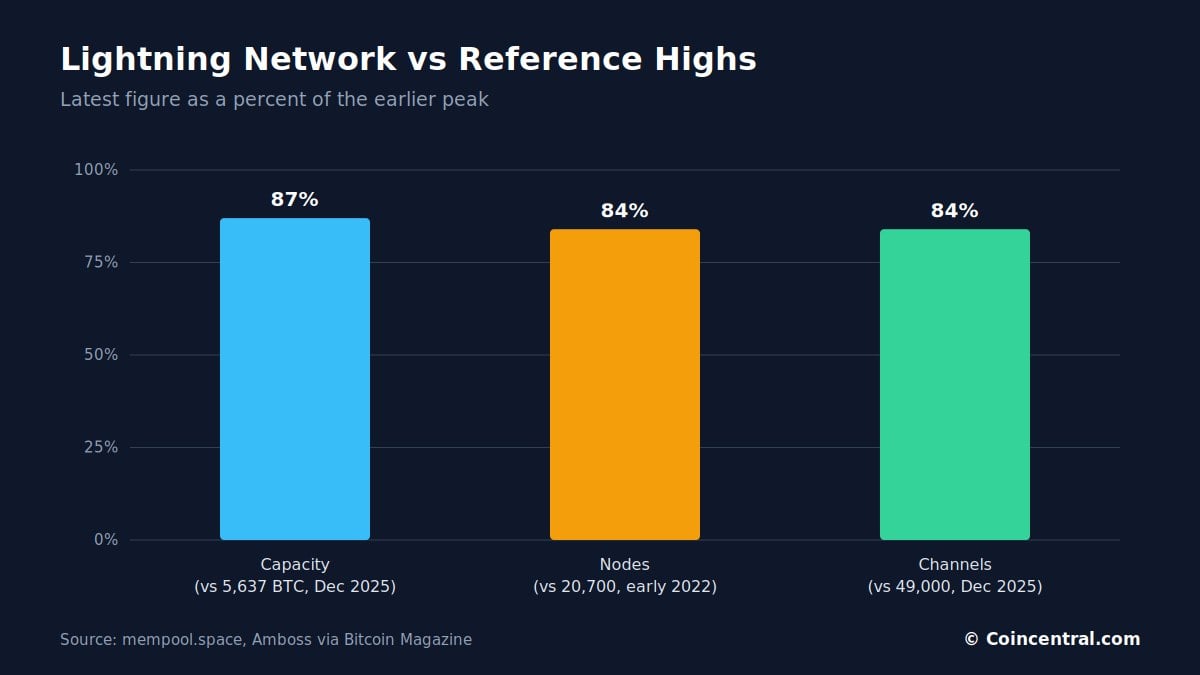
Public capacity reached a record 5,637 BTC in December 2025. It has since fallen to about 4,900 BTC. Mempool.space data shows around 17,400 nodes and 41,000 public channels.
Usage tells a different story. River estimates Lightning processed about $1.17 billion in payments in November 2025, more than four times the $286.5 million estimated a year earlier.
This article covers the main Lightning Network statistics for 2026. It looks at capacity, nodes, channels, payment volume, fees and new moves from Square and Lightning Labs.
Lightning Network Statistics at a Glance
The table below sums up the main figures from recent network and payment data. Network figures come from mempool.space unless stated. Payment figures are estimates from River.
| Metric | Latest figure |
|---|---|
| Public capacity | About 4,900 BTC |
| Record capacity (December 2025) | About 5,637 BTC |
| Observed nodes | About 17,400 |
| Public channels | About 41,000 |
| Nodes on Tor | About 9,000 |
| Nodes on clearnet | About 4,700 |
| Average public channel size | About 0.119 BTC |
| Monthly payment volume (November 2025) | About $1.17 billion |
| Monthly payment volume (November 2024) | $286.5 million |
| Monthly payment volume (August 2021) | $12.1 million |
| Monthly transactions (November 2025) | About 5.22 million |
| Average payment (November 2025) | About $223 |
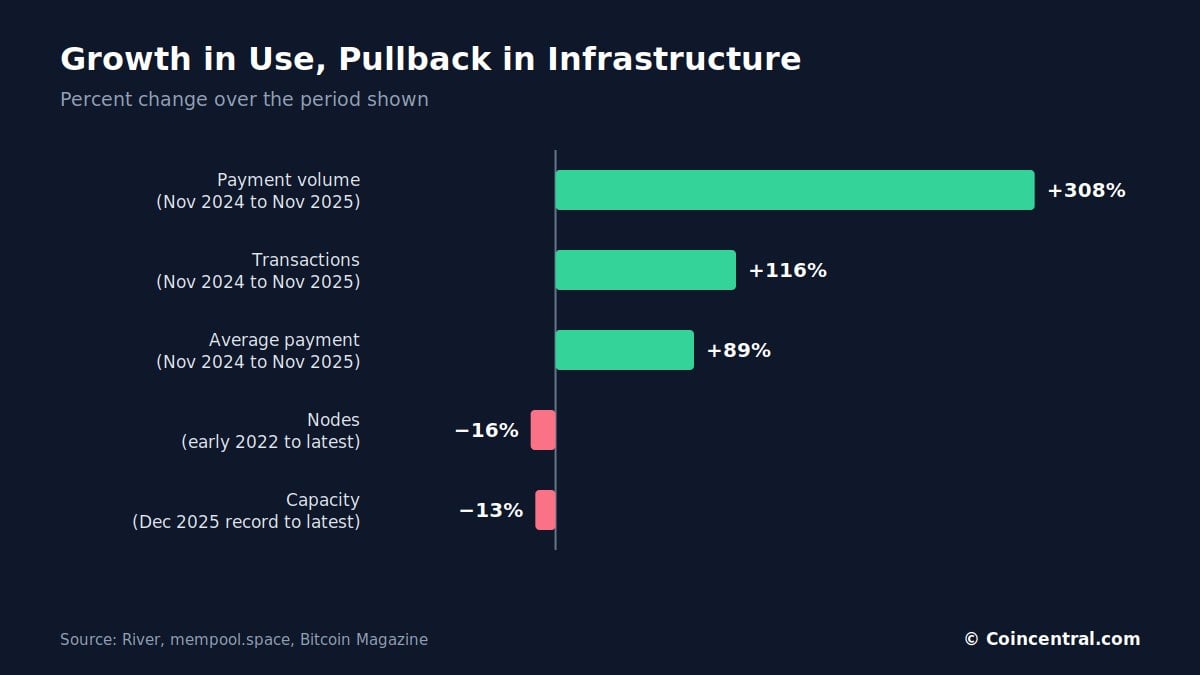
Public capacity is about 13% below its record. Nodes are about 16% below the early 2022 peak. Channels are about 16% below the level seen around December 2025.
Three points stand out from the data:
- Public capacity, nodes and channels are all below earlier highs.
- Payment volume, transactions and average payment size are all well above last year.
- Counts differ by source, so each figure needs a named source.
Payment value moved the other way. Estimated monthly volume is about 97 times higher than in August 2021.
These figures need careful reading. Lightning is harder to measure than Bitcoin’s main blockchain, a point covered in more detail below.
What Is the Bitcoin Lightning Network?
The Lightning Network is a payment layer built on top of Bitcoin. Instead of recording every payment on the blockchain, users open payment channels and trade off-chain.
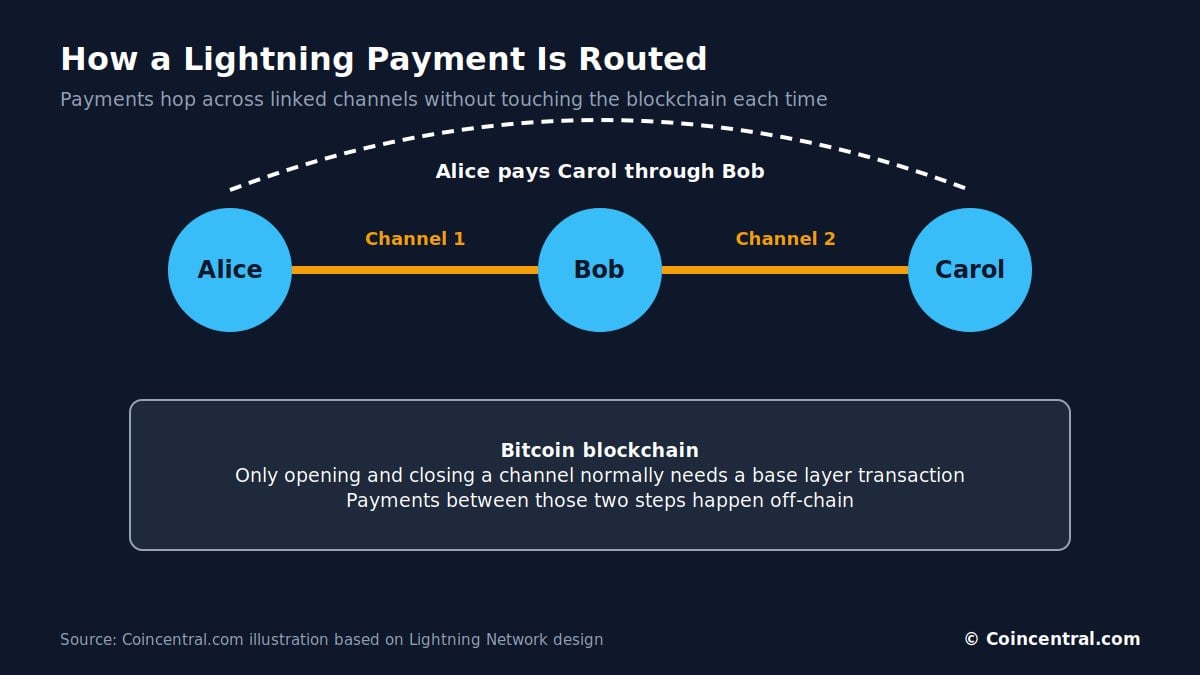
Only the opening and closing of a channel generally needs to appear on Bitcoin’s base layer. Payments in between can be routed across linked channels using other Lightning nodes.
The design targets a known limit of Bitcoin. The base layer favors security and decentralization over handling thousands of payments each second.
A channel works like a shared pool of Bitcoin between two parties. Funds shift toward one side as payments flow. A payment can pass through a channel only if enough liquidity sits on the right side.
Supporters point to several benefits:
- Near-instant settlement
- Very low payment fees
- Higher transaction capacity
- Less congestion on the base layer
- Support for micropayments
In simple terms, Lightning is a payment network that uses Bitcoin as its settlement asset.
How Much Bitcoin Is on the Lightning Network?
Capacity is the amount of Bitcoin locked inside Lightning payment channels. That Bitcoin provides the liquidity needed to route payments.
Recent mempool.space data puts public capacity at about 4,900 BTC. At an assumed Bitcoin price of $80,000, that is almost $400 million in publicly visible liquidity. The dollar figure moves with the Bitcoin price.
Data from Amboss, cited by Bitcoin Magazine, showed public capacity reaching about 5,637 BTC in December 2025. That was a new all-time high. It followed several years when headline capacity was mostly flat.
Capacity had dropped to about 4,200 BTC in August 2025 before rebounding late in the year. The latest level is about 13% below the record and about 17% above that low.
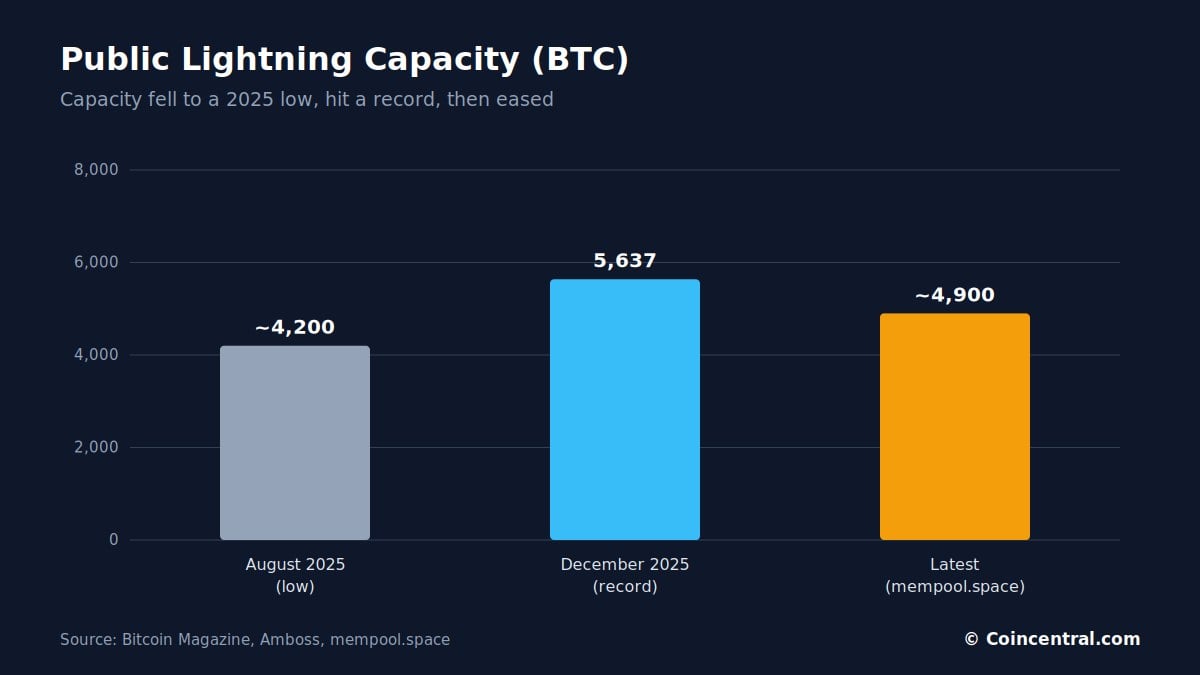
The path is not a straight line. Exchanges, payment companies and routing operators can open or close large channels, which moves the total quickly.
Capacity shows how much liquidity is available, not how much is used. Payment volume, covered later in this article, measures actual use.
Bitcoin’s price also changes how large the network looks in dollars. A price rise lifts the dollar value of the same BTC capacity, and a fall lowers it.
Public capacity also leaves out part of the network. Private or unannounced channels do not share all their details. They are common with mobile wallets, service providers, exchanges, enterprise payment systems and custodial services.
Public capacity is best read as a lower bound. Some industry estimates suggest private capacity may be large, but no authoritative real-time figure exists for hidden capacity.
How Many Lightning Nodes Are There?
Mempool.space data shows about 17,400 Lightning nodes. The table breaks them down by how they can be reached.
| Node type | Approximate count |
|---|---|
| Tor | 9,000 |
| Clearnet | 4,700 |
| Both clearnet and Tor | 1,800 |
| Unannounced | 2,000 |
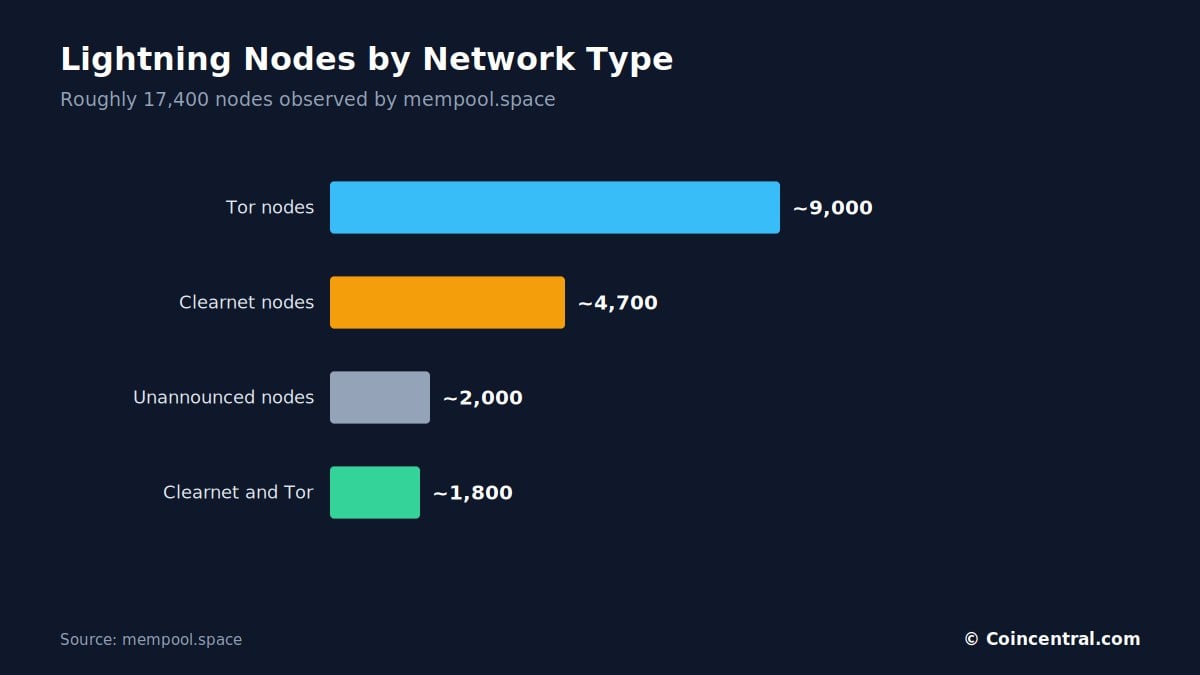
The count is down from earlier highs. Bitcoin Magazine reported about 20,700 nodes in early 2022. That is a drop of about 16%.
Tor nodes use an anonymity network that hides the operator’s address. Clearnet nodes can be reached over the regular internet. The large Tor share shows how many operators choose privacy.
A falling node count does not always mean falling use. A network can handle more payments with fewer, larger and better-connected nodes.
Fewer nodes can raise centralization concerns if more payments depend on a few major hubs. The largest nodes now run hundreds or thousands of channels.
Still, node count alone does not measure decentralization. Other measures matter as well:
- Distribution of liquidity
- Routing success rates
- Channel concentration
- Custodial versus non-custodial use
- Number of independent operators
These measures are harder to track than a simple node count.
Node count still works as a rough gauge of how many operators take part. It just should not be read alone.
Why Different Sites Show Different Lightning Numbers
Anyone who checks several Lightning explorers will see different totals. 1ML recently reported about 5,900 active nodes and 20,000 active channels. Mempool.space reported about 17,400 nodes and 41,000 channels.
| Metric | 1ML | mempool.space |
|---|---|---|
| Nodes | 5,900 | 17,400 |
| Channels | 20,000 | 41,000 |
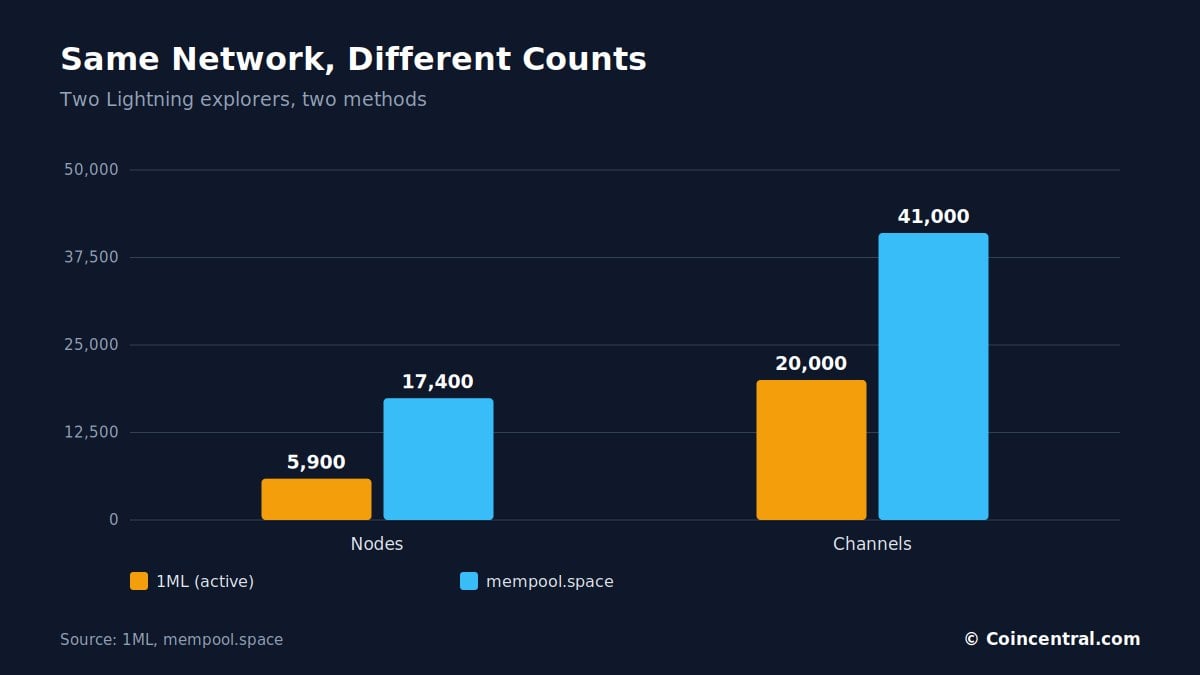
Neither set of numbers is necessarily wrong. The sites use different methods to decide whether a node or channel is active, reachable or visible.
1ML says its numbers are approximations. Lightning is decentralized, and nodes that do not share their state cannot be seen.
Payments are even harder to count. Lightning has no public ledger of every payment, so River builds estimates from anonymized data supplied by large operators.
Its 2026 analysis used data from River, Wallet of Satoshi, Kraken, ACINQ, Breez, THNDR, Lightspark, LQwD and LNBig. Private transactions may be missed, so observed volume could understate real use.
For that reason, this article names the source of each figure instead of treating any one count as an exact total.
This matters for anyone quoting Lightning data. Mixing a node count from one site with a channel count from another can give a picture that does not match either source.
How Many Lightning Channels Are There, and How Big Are They?
Mempool.space shows about 41,000 public channels. That compares with about 49,000 around the December 2025 capacity high.
A user does not need a direct channel with each person they want to pay. If Alice has a channel with Bob, and Bob has one with Carol, Alice may be able to pay Carol through Bob. A large linked network can serve more payments than the raw channel count suggests.
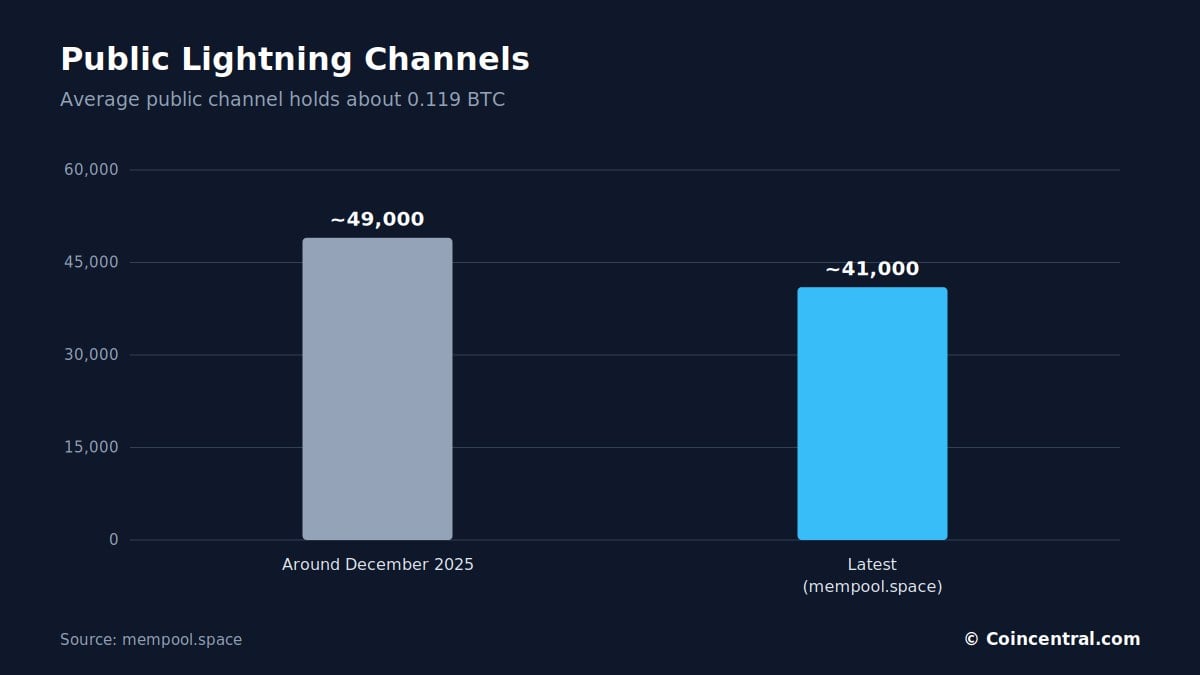
Channels are also getting larger. The average public channel holds about 11.9 million satoshis, or about 0.119 BTC.
The network appears to be centered on professional routing operators, exchanges and payment companies that run large channels. Major liquidity providers include Bitfinex, Binance, ACINQ, OKX and Kraken.
Fewer, larger channels can make routing more efficient. A single large channel can carry payments that would otherwise need several small ones. The tradeoff is that more liquidity sits with a smaller group of operators.
Large infrastructure providers also host a share of visible liquidity. Mempool.space data shows channel capacity tied to Amazon Web Services, Google Cloud, DigitalOcean and Hetzner.
Hosting on shared cloud services is one more factor to weigh when judging how spread out the network is.
Lightning Payment Volume Passed $1 Billion a Month
Payment activity shows clearer growth than node or channel counts. River’s 2026 Bitcoin Adoption Report estimated that Lightning processed about $1.17 billion in November 2025.
It was the first time River’s network-wide estimate topped $1 billion in a month.
| Period | Estimated monthly volume |
|---|---|
| August 2021 | $12.1 million |
| August 2023 | $78.2 million |
| November 2024 | $286.5 million |
| November 2025 | $1.17 billion |
From November 2024 to November 2025, estimated volume grew about 308%. River describes this as roughly 300% annual growth.
Earlier growth was steady too. Volume rose from $12.1 million in August 2021 to $78.2 million in August 2023, about 6.5 times as much. It then reached $286.5 million by November 2024, about 3.7 times the 2023 figure.
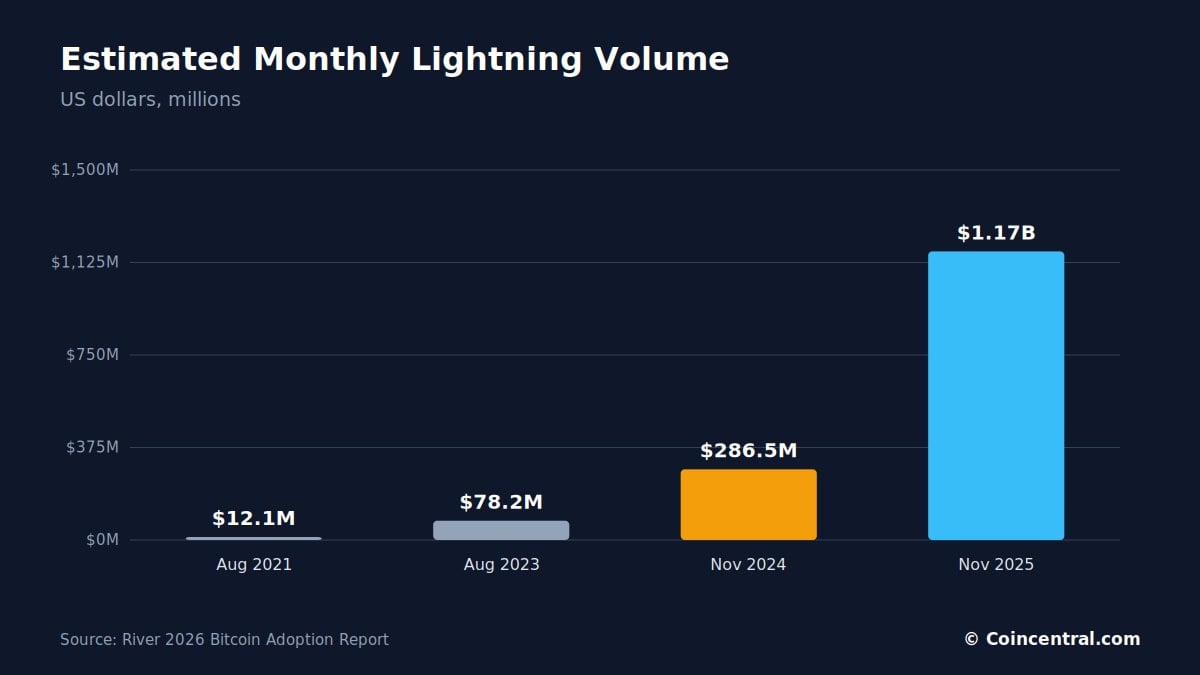
Against August 2021, monthly volume is about 97 times higher. This is one of the clearest signs that node count alone is a weak measure of Lightning adoption.
Because River’s figures are estimates, exact dollar amounts may shift as new data arrives. The direction of change has been the same across every period River reports.
Monthly Lightning Transactions Top Five Million
River estimated about 5.22 million Lightning transactions in November 2025. That is more than double the 2.42 million estimated a year earlier.
| Period | Estimated transactions |
|---|---|
| August 2021 | 503,000 |
| August 2023 | 6.60 million |
| November 2024 | 2.42 million |
| November 2025 | 5.22 million |
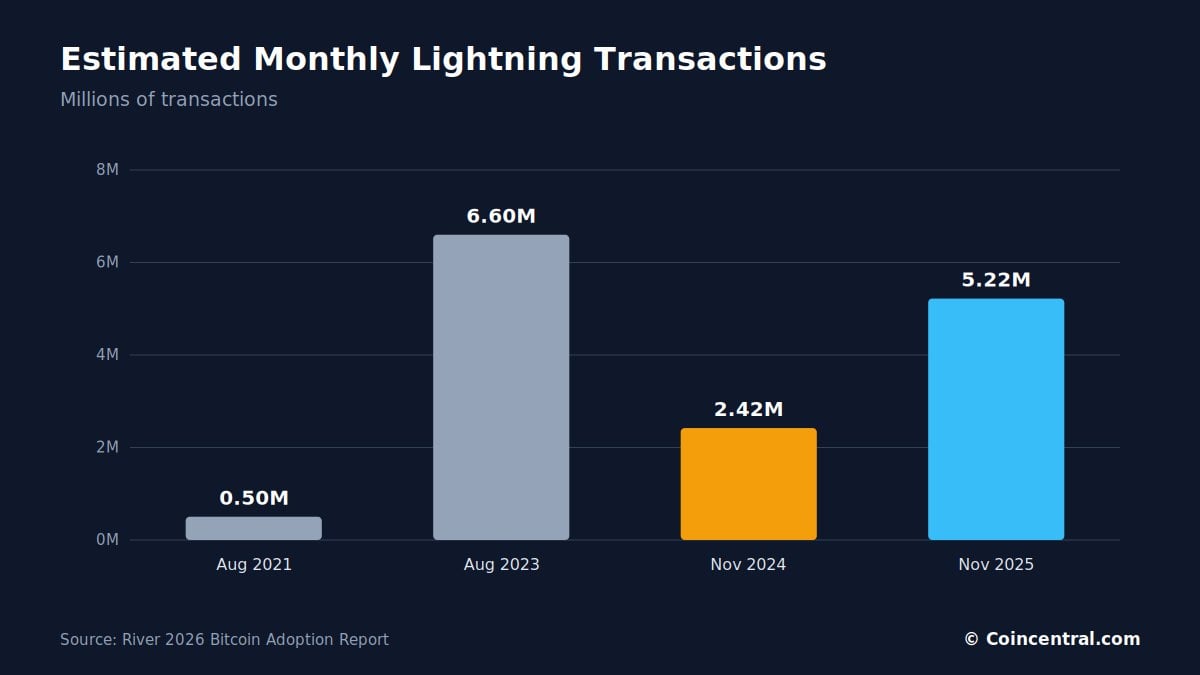
The count is still below the 6.60 million estimated for August 2023. Yet payment value is far higher today.
Compared with August 2021, transactions are about ten times higher. Compared with August 2023, they are about 21% lower.
That points to a change in the type of payments. The next section looks at the size of each one.
The Average Lightning Payment Reached $223
River estimates the average Lightning payment was about $223 in November 2025. A year earlier it was about $118.
Lightning was first linked to micropayments, such as small online tips and low-cost purchases. Those uses still exist.
Larger exchange deposits, withdrawals and transfers have grown in importance. That helps explain why volume has grown faster than transaction count.
| Period | Average payment | Basis |
|---|---|---|
| August 2021 | About $24 | Calculated |
| August 2023 | About $12 | Calculated |
| November 2024 | About $118 | River estimate |
| November 2025 | About $223 | River estimate |
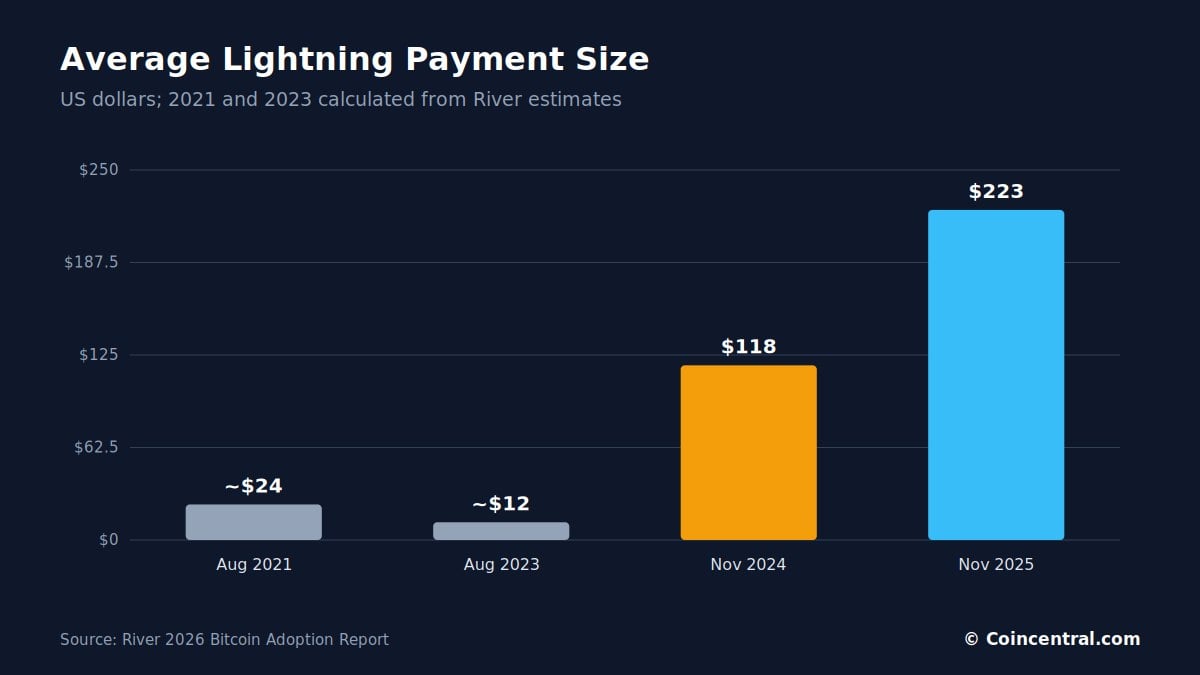
The 2021 and 2023 averages are calculated by dividing River’s volume estimate by its transaction estimate. They are rough figures.
From November 2024 to November 2025, the average payment rose about 89%. Transactions grew about 116% over the same period, and volume grew about 308%.
The network is not only handling more payments. It is handling higher-value ones.
Payment size also depends on who is paying. A wallet sending a small tip and an exchange moving customer funds can differ by a large factor.
How Lightning Stretches Bitcoin’s Capacity
One on-chain transaction can open or close a channel that later carries many payments. That makes it misleading to judge Bitcoin by its base-layer transaction count alone.
River studied its own Lightning infrastructure from 2019 to early 2024. It routed about 3.97 million Lightning payments and tied about 15,766 on-chain transactions to that activity, counting peer channel openings.
That works out to about 252 Lightning payments for each on-chain transaction. When River counted only on-chain transactions it started itself, the ratio rose to about 759.
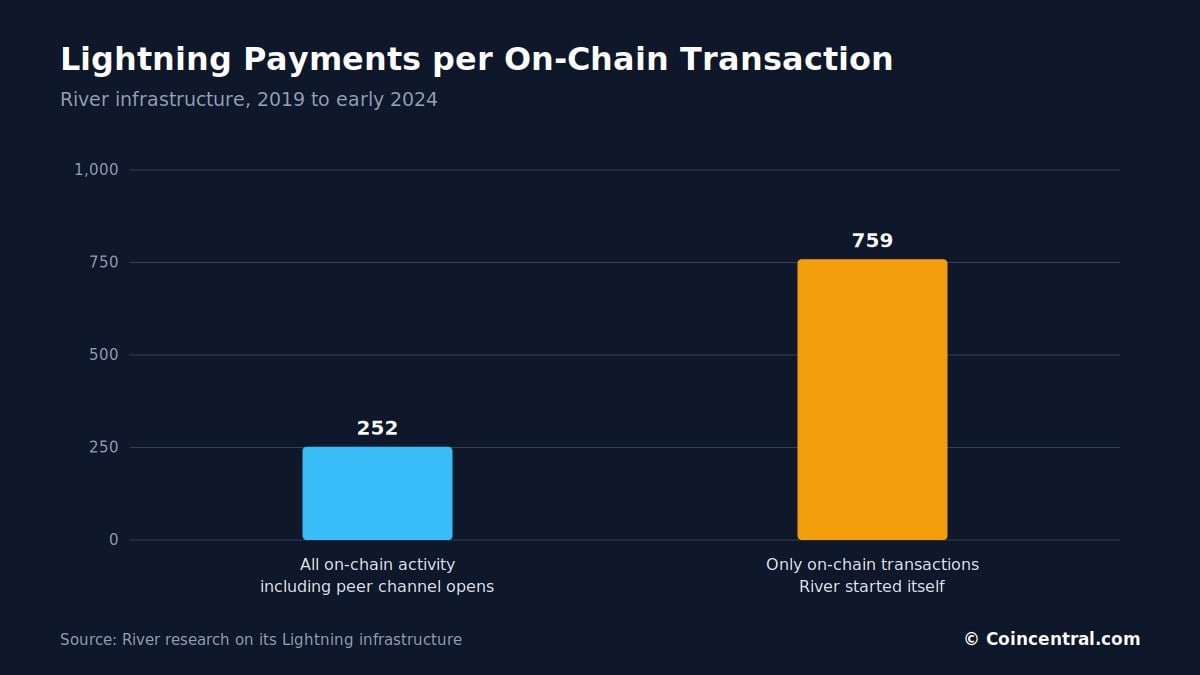
These numbers come from one company and may not match the whole network. They do show how a second layer can raise Bitcoin’s payment throughput without a matching rise in base-layer transactions.
The pattern helps explain why Lightning can grow without crowding the base layer. Each channel needs only a few on-chain transactions, while the payments inside it can be many.
Square Brings Lightning to Merchants
Block announced Bitcoin payments for Square in 2025 and expanded the system in 2026. Eligible U.S. merchants can now accept Bitcoin payments through Lightning.
Merchants can choose to receive Bitcoin or U.S. dollars. Customers can pay with Lightning-enabled wallets, including Cash App and other compatible apps. Payments normally settle within seconds.
Square began automatically enabling eligible U.S. sellers on March 30, 2026. By default, payments can settle in U.S. dollars, so merchants do not have to hold Bitcoin.
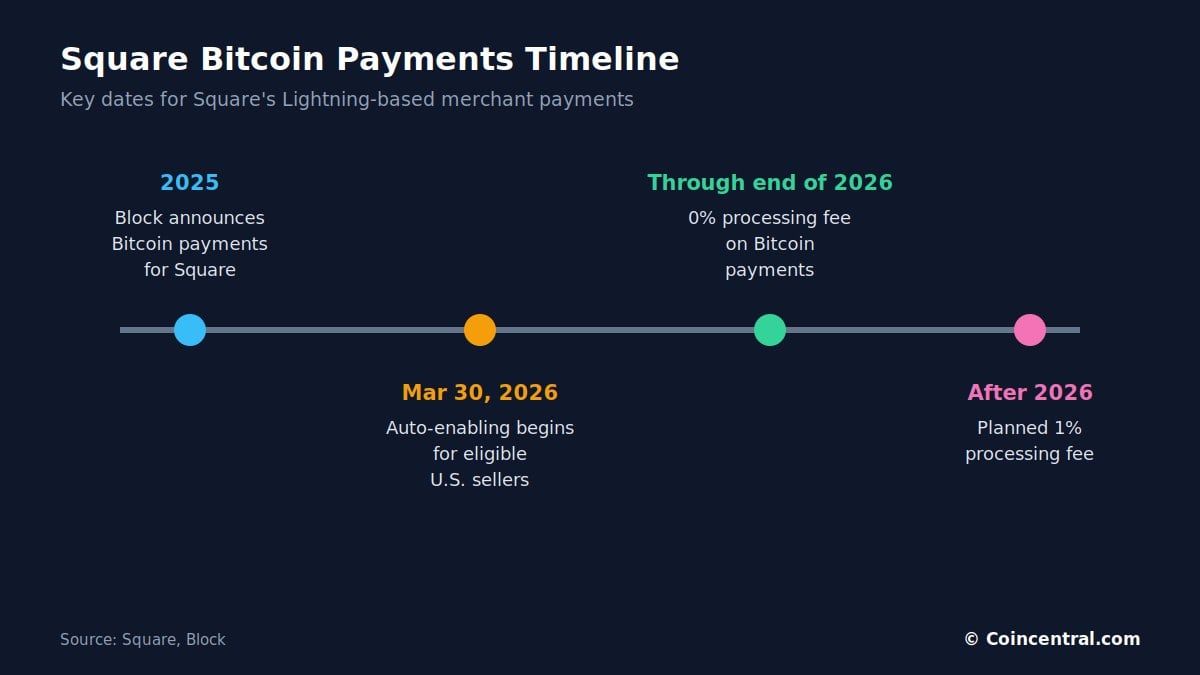
Square charges 0% in processing fees through the end of 2026. A fee of 1% is planned after that.
The setup matters because merchants do not need to manage channels, run nodes or handle liquidity. The experience looks like accepting any other digital payment.
Building Lightning into existing point-of-sale systems could put Bitcoin payments in front of millions of merchants without new equipment.
No Square payment volume figures were in the data reviewed. The effect on network totals will become clearer as merchants begin to use the feature.
Taproot Assets Take Lightning Beyond Bitcoin
Taproot Assets is a protocol from Lightning Labs. It lets other assets be issued on Bitcoin and sent over Lightning.
The most discussed use is stablecoins. Tether announced in 2025 that USDT would be added to Bitcoin and Lightning using Taproot Assets.
Lightning Labs released Taproot Assets v0.8 and its first public SDK in June 2026. The SDK is meant to make it easier for developers to build apps that handle several assets over Lightning.
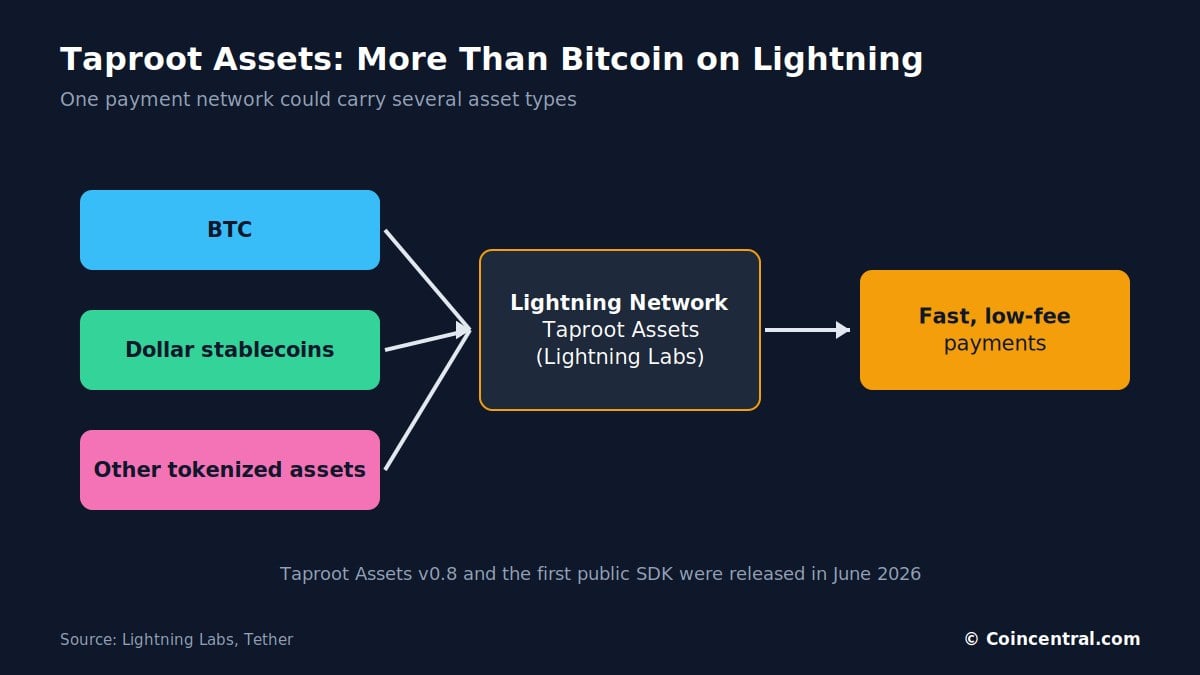
In time, the network could route BTC, dollar stablecoins and other tokenized assets over the same payment infrastructure. That could widen the market Lightning can serve.
Stablecoins track the value of a currency such as the U.S. dollar. That avoids the price swings that can make Bitcoin hard to use for everyday prices.
It is still early. The data reviewed for this article included no usage figures for these assets.
Tether’s announcement and the v0.8 release are steps in a longer plan. Stablecoin volume on Lightning will need to be measured separately from BTC volume.
Lightning Fees Remain Low
Routing nodes typically charge a small base fee plus a proportional fee based on payment size. Mempool.space puts the average advertised proportional fee at about 800 parts per million.
One thousand parts per million equals 0.1%, so 800 parts per million is 0.08%. Actual fees vary by route, liquidity and wallet.
| Fee type | Rate |
|---|---|
| Average advertised Lightning routing fee | About 0.08% |
| Square Bitcoin payments through 2026 | 0% |
| Square Bitcoin payments, planned after 2026 | 1% |
| Conventional card processing | About 2% to 3% |
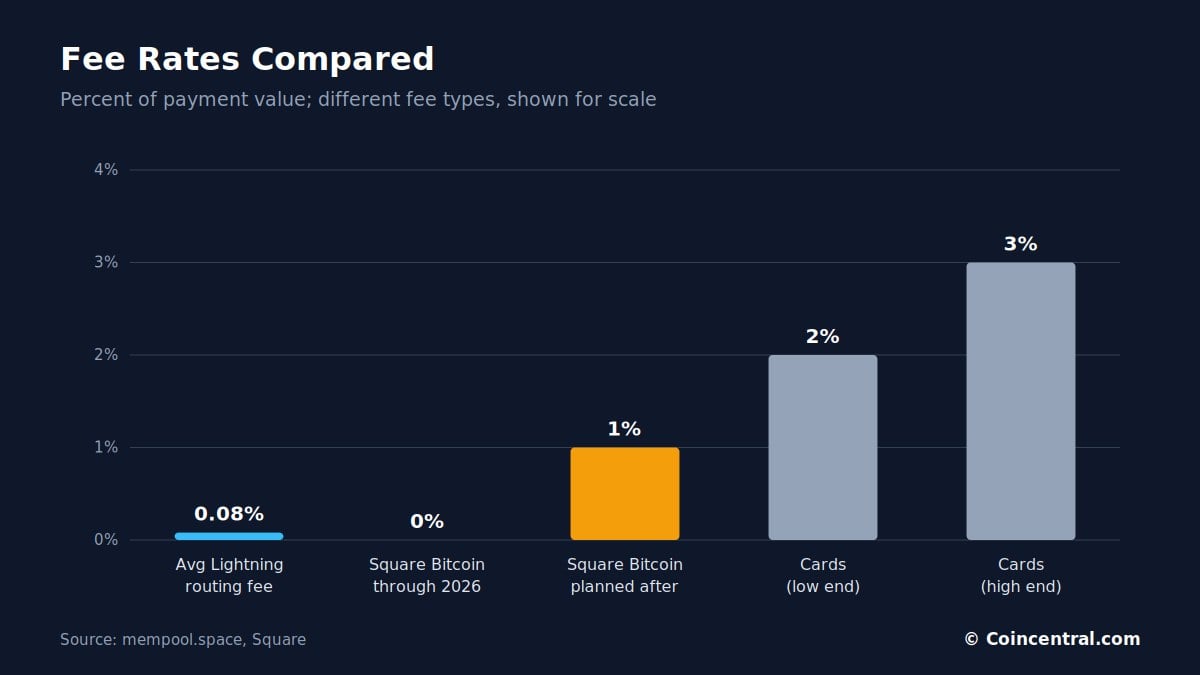
Users may also pay fees charged by exchanges or custodial services. Even so, direct routing fees can be far lower than card charges of about 2% to 3%.
Here is a simple example. On a $223 payment, a 0.08% fee is about 18 cents. A 2% to 3% card fee on the same amount is about $4.46 to $6.69.
The Lightning example counts only the average advertised routing fee. Base fees and any wallet or exchange charges would add to the total.
The fee types in the chart are not identical, so the comparison shows scale only. Low fees may suit international payments and low-margin sales.
The Bottom Line
Lightning entered 2026 in a different place from a few years ago. Public data shows about 4,900 BTC of visible capacity, about 17,400 nodes and about 41,000 channels under mempool.space’s methods.
Capacity is below the 5,637 BTC record from December 2025. Nodes and channels are below earlier peaks.
Payment data points the other way. River estimates monthly volume hit $1.17 billion in November 2025, up about 300% from $286.5 million a year earlier. About 5.22 million transactions took place, with an average value near $223.
Merchant tools are growing too. Square’s integration lets eligible U.S. businesses accept Lightning payments that settle in seconds, and Taproot Assets could make Lightning a route for stablecoins.
The most useful Lightning statistic may no longer be the node or channel count. It may be how much value the network moves with the liquidity it already has.
On that measure, Lightning’s payment network is larger in 2026 than its infrastructure counts suggest.
Several data points are worth watching in the months ahead:
- Whether public capacity moves back above the 5,637 BTC record
- Changes in node and channel counts
- River’s next network-wide payment estimates
- How merchants respond when Square’s fee plan changes after 2026
- Real usage figures for stablecoins on Lightning
Sources
- River: What’s Driving Bitcoin Adoption in 2026
- River: 2026 Bitcoin Adoption Report
- mempool.space: Lightning Network Dashboard
- mempool.space: Lightning API Documentation
- 1ML: Lightning Network Statistics
- Bitcoin Magazine: Lightning Capacity Hits New All-Time High
- Bitcoin Magazine: Lightning Network Surpasses $1 Billion in Monthly Volume
- River: Lightning Network Grew by 1,212% in Two Years
- Square: Accept Bitcoin Payments
- Square: Bitcoin Payments Support Documentation
- Lightning Labs: Taproot Assets v0.8
- Tether: USDT on Bitcoin and Lightning
The post Bitcoin Lightning Network Statistics 2026: Capacity, Nodes and Payment Growth appeared first on Blockonomi.
This articles is written by : Nermeen Nabil Khear Abdelmalak
All rights reserved to : USAGOLDMIES . www.usagoldmines.com
You can Enjoy surfing our website categories and read more content in many fields you may like .
Why USAGoldMines ?
USAGoldMines is a comprehensive website offering the latest in financial, crypto, and technical news. With specialized sections for each category, it provides readers with up-to-date market insights, investment trends, and technological advancements, making it a valuable resource for investors and enthusiasts in the fast-paced financial world.