Key takeaways
- The 2026 forecast puts LINK’s full-year range at $7 to $16, with an estimated average of $10.
- LINK could reach $36 in 2029 if demand for Chainlink’s data and cross-chain services grows alongside a stronger crypto market.
- The bullish scenario reaches $50 in 2032, still below LINK’s all-time high of $52.88.
Chainlink helps smart contracts access data from outside their own blockchains and move information between networks. Its LINK token was trading near $10.31 on Binance after losing ground through October and early November. The immediate question is whether LINK can hold above $10.10. Over the longer term, the case for a recovery depends on whether projects using Chainlink’s services move from testing to sustained use.
Overview
| Metric | Value |
|---|---|
| Cryptocurrency | Chainlink |
| Token symbol | LINK |
| Price | $10.36 |
| Market cap | $7.75B |
| Trading volume (24h) | $246.06M |
| Circulating supply | 748.09M LINK |
| All-time high | $52.88 (May 10, 2021) |
| All-time low | $0.1263 (Sept. 23, 2017) |
| 24-hour high | $10.69 |
| 24-hour low | $10.14 |
Chainlink price prediction: Technical analysis
| Metric | Value |
|---|---|
| Price prediction (1 month) | $11.77 |
| Volatility | 5.88% (High) |
| 50-day SMA | $12.51 |
| 14-day RSI | 39.59 (Neutral) |
| Current sentiment | Bearish |
| Crypto Fear & Greed Index | 32 (Fear) |
| Green days | 14/30 (47%) |
| 200-day SMA | $10.10 |
Chainlink price analysis
TL;DR breakdown
- LINK is trading near $10.31 on the daily chart, close to its $10.14 lower Bollinger Band.
- On the four-hour chart, LINK briefly reached $10.45 before slipping back below all three Alligator lines.
- A move above $10.44–$10.61 would give LINK room to recover toward $11.13.
Chainlink 1-day technical outlook
As of November 11, 2026, LINK is trading near $10.31 after retreating from above $11.00 earlier in the month. The token sits just above the lower Bollinger Band at $10.14 and well below the falling middle band at $11.13.
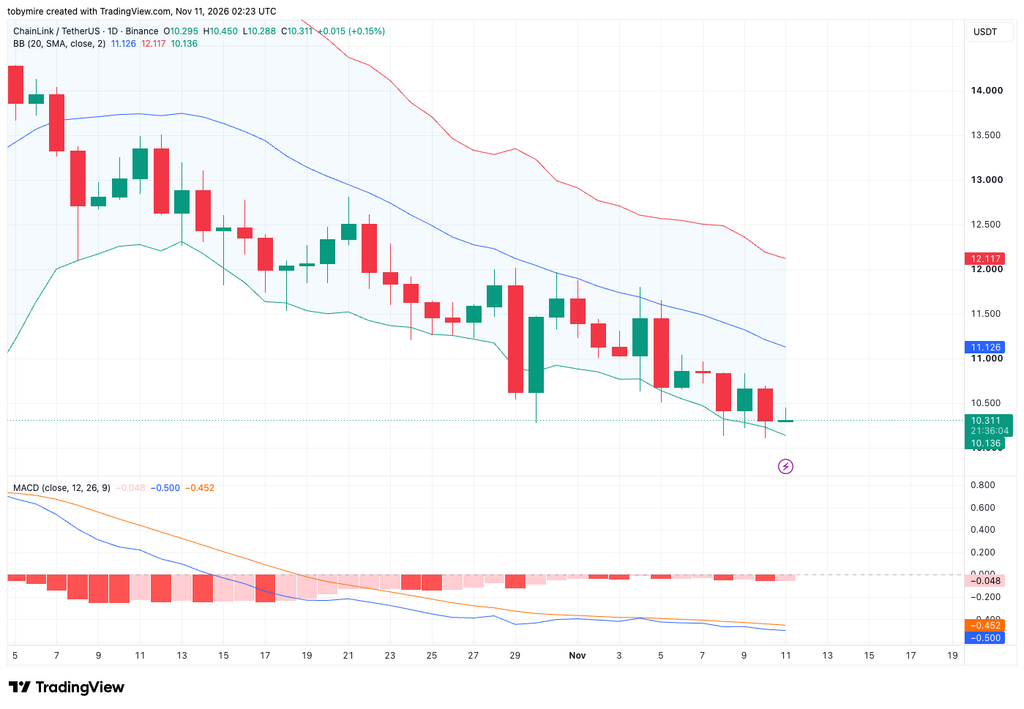
The MACD line is at −0.500, below its signal line at −0.452, while the histogram remains negative at −0.048. The recent low near $10.10 is the first area of support, and a recovery toward $11.13 would be a stronger sign that selling pressure is easing.
Chainlink 4-hour price chart
LINK is trading near $10.31 after touching $10.45 during the four-hour candle. All three Alligator lines are above the token, with the green, red and blue lines at $10.44, $10.51 and $10.61, respectively.
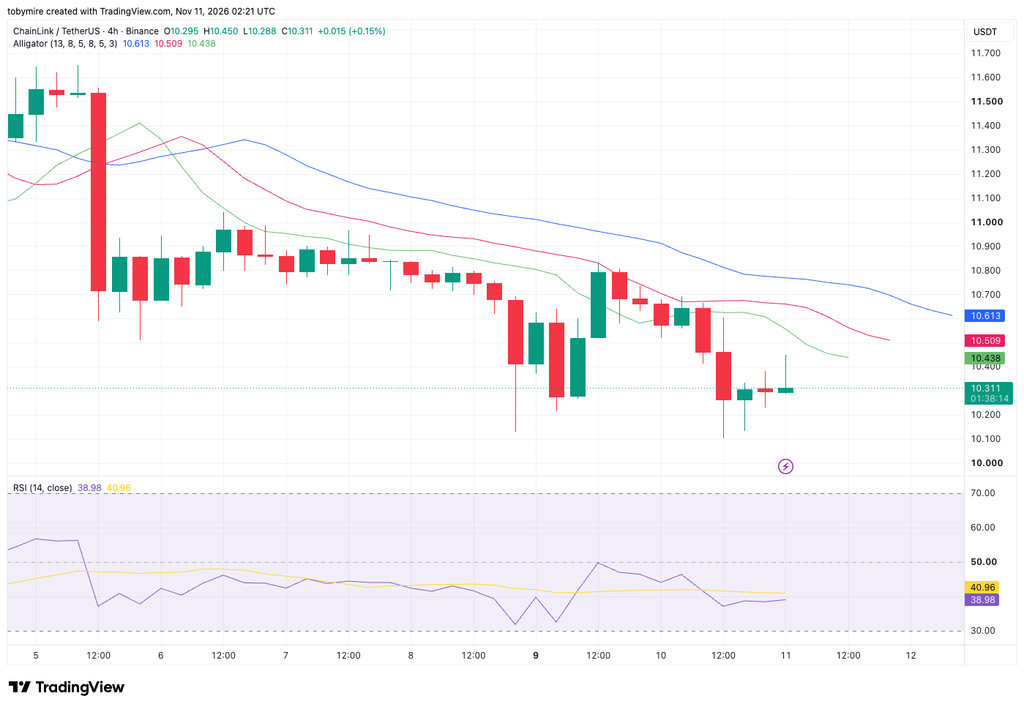
The RSI has edged up to 38.98 but remains below its moving average of 40.96, showing that the bounce has gained little momentum. A sustained move above $10.61 would strengthen the recovery, while a break below $10.10 would erase the recent bounce.
Chainlink technical indicators: Levels and action
Daily simple moving average (SMA)
| Period | Value | Action |
|---|---|---|
| SMA 3 | $10.43 | Sell |
| SMA 5 | $10.59 | Sell |
| SMA 10 | $10.86 | Sell |
| SMA 21 | $11.25 | Sell |
| SMA 50 | $12.44 | Sell |
| SMA 100 | $11.58 | Sell |
| SMA 200 | $10.09 | Buy |
Daily exponential moving average (EMA)
| Period | Value | Action |
|---|---|---|
| EMA 3 | $10.45 | Sell |
| EMA 5 | $10.57 | Sell |
| EMA 10 | $10.81 | Sell |
| EMA 21 | $11.23 | Sell |
| EMA 50 | $11.69 | Sell |
| EMA 100 | $11.39 | Sell |
| EMA 200 | $10.85 | Sell |
What to expect from Chainlink?
LINK is holding near $10.10, but the bounce has yet to clear the first cluster of resistance between $10.44 and $10.61. If the token gets above that zone and holds it, the daily Bollinger middle band near $11.13 is the next test. A break below $10.10 would put $10.00 in play.
Is Chainlink a good investment?
LINK offers exposure to the use of blockchain data feeds and cross-chain infrastructure. The investment case depends on whether wider use of those services translates into sustained demand for the token. Institutional pilots are evidence of interest, but they leave open questions about production use, fees and the demand those fees could create for LINK.
Will Chainlink reach $50?
A move from $10.31 to $50 would require a gain of roughly 385%. LINK has traded above that level before, reaching $52.88 in May 2021. In this forecast, $50 is the bullish 2032 scenario and would likely require both a stronger crypto market and sustained growth in Chainlink usage.
Does LINK have a good long-term future?
Chainlink’s long-term case rests on demand for reliable off-chain data and communication between blockchains. For LINK holders, the key measure is how much recurring token demand those services generate as projects move into production. Competition and a weaker crypto market could limit returns even if more projects integrate Chainlink.
Recent news on Chainlink
Moody’s tests multichain ratings distribution with Chainlink
Chainlink said on Nov. 10 that it helped Moody’s Ratings test the simultaneous distribution of credit ratings across multiple blockchains. The pilot used Moody’s Token Integration Engine to show how credit ratings could be shared across networks used by tokenized markets.
Chainlink price prediction November 2026
LINK could trade between $9.50 and $12.20 in November, with an estimated average of $10.80.
| Period | Minimum price | Average price | Maximum price |
|---|---|---|---|
| Chainlink price prediction November 2026 | $9.50 | $10.80 | $12.20 |
Chainlink price prediction 2026
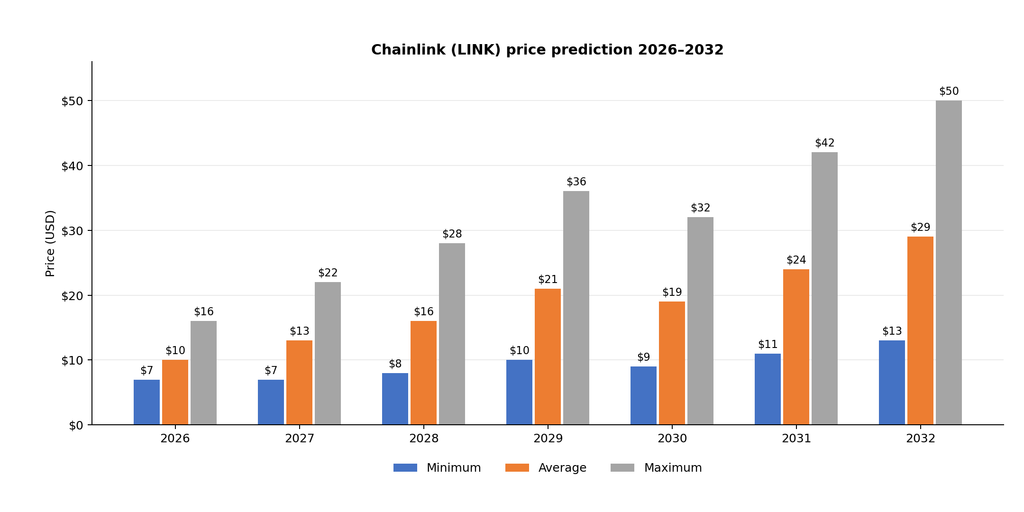
The full-year estimate puts LINK between $7 and $16, with an average near $10.
| Period | Minimum price | Average price | Maximum price |
|---|---|---|---|
| Chainlink price prediction 2026 | $7 | $10 | $16 |
Chainlink price predictions 2027–2032
| Year | Minimum price | Average price | Maximum price |
|---|---|---|---|
| 2027 | $7 | $13 | $22 |
| 2028 | $8 | $16 | $28 |
| 2029 | $10 | $21 | $36 |
| 2030 | $9 | $19 | $32 |
| 2031 | $11 | $24 | $42 |
| 2032 | $13 | $29 | $50 |
Chainlink price prediction 2027
LINK could trade between $7 and $22 in 2027, averaging around $13. The upper end assumes the token can clear its 2026 high and sustain that recovery.
Chainlink price prediction 2028
The forecast places LINK between $8 and $28 in 2028, with an estimated average of $16.
Chainlink price prediction 2029
LINK could average $21 in 2029, with a low of $10 and a high of $36 under stronger market conditions.
Chainlink price prediction 2030
The 2030 forecast allows for a pullback after a stronger 2029. LINK could trade between $9 and $32, with an estimated average of $19.
Chainlink price prediction 2031
LINK could reach $42 in 2031 if demand strengthens, with a projected low of $11 and an average near $24.
Chainlink price prediction 2032
The 2032 forecast puts LINK between $13 and $50, with an estimated average of $29. The upper end would bring the token within about $3 of its all-time high.
Chainlink market price prediction: External forecasts
| Source | 2026 estimate | 2027 estimate | Basis |
|---|---|---|---|
| CoinCodex | $12.35 | $26.86 | December monthly average |
| CoinPriceForecast | $13.17 | $17.58 | Year-end target |
Cryptopolitan’s Chainlink price prediction
The forecast puts LINK between $7 and $16 in 2026, with an estimated average of $10. For 2027, the projected range widens to $7–$22, with an average of $13. That leaves room for a recovery beyond the 2026 high and for a return to the year’s lows if market conditions weaken.
Chainlink historic price sentiment
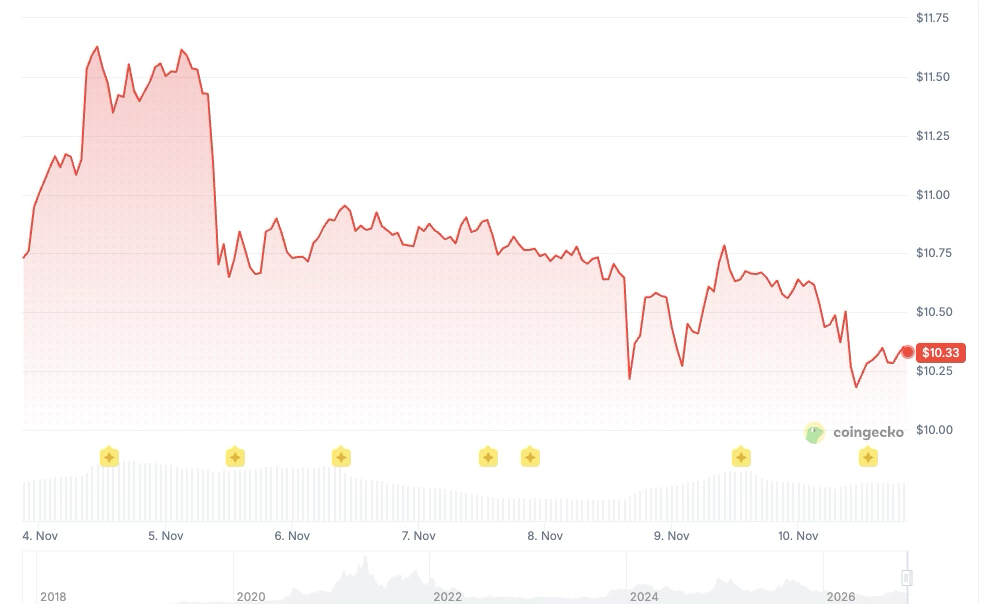
- CoinMarketCap records LINK’s all-time low at $0.1263 in September 2017 and its all-time high at $52.88 in May 2021.
- LINK opened 2026 at $12.19 and traded between $7.02 and $15.74 through Nov. 10.
- In September, LINK opened at $11.32, ranged from $10.63 to $15.74 and closed at $14.36, up 26.9% from the monthly open. Its average daily close was $12.47.
- In October, LINK traded between $10.31 and $14.63 and closed at $11.65, down 18.8% from September’s close. Its average daily close was $12.53.
- Through Nov. 10, LINK traded between $10.14 and $11.83 and averaged $10.86 on a daily closing basis. It closed Nov. 10 at $10.28, down 11.8% from October’s close.
This articles is written by : Nermeen Nabil Khear Abdelmalak
All rights reserved to : USAGOLDMIES . www.usagoldmines.com
You can Enjoy surfing our website categories and read more content in many fields you may like .
Why USAGoldMines ?
USAGoldMines is a comprehensive website offering the latest in financial, crypto, and technical news. With specialized sections for each category, it provides readers with up-to-date market insights, investment trends, and technological advancements, making it a valuable resource for investors and enthusiasts in the fast-paced financial world.