
Chainlink (LINK) is trading around $22 after gaining almost 10% over the past week. Daily price movement shows a slight dip, while trading volume stands near $950 million.
Attention is now on whether LINK can continue its climb toward $47, a level that matches the highs of 2021.
Technical Setup Signals Higher Levels
Analyst Ali Martinez shared a 3-day chart showing LINK moving inside an ascending parallel channel since 2023. The price action is holding above $20, which aligns with the 0.786 Fibonacci retracement level. Staying above this zone gives room for further gains.
Notably, the projection marks potential steps toward $29, $35–$39, and then $46 at the 1.272 Fibonacci extension. That level also meets the top line of the channel. Martinez wrote,
$47 could be next for Chainlink $LINK! https://t.co/N2QWDZNiIB pic.twitter.com/HNjRP9Kyp2
— Ali (@ali_charts) October 2, 2025
Channel Structure and All-Time High Zone
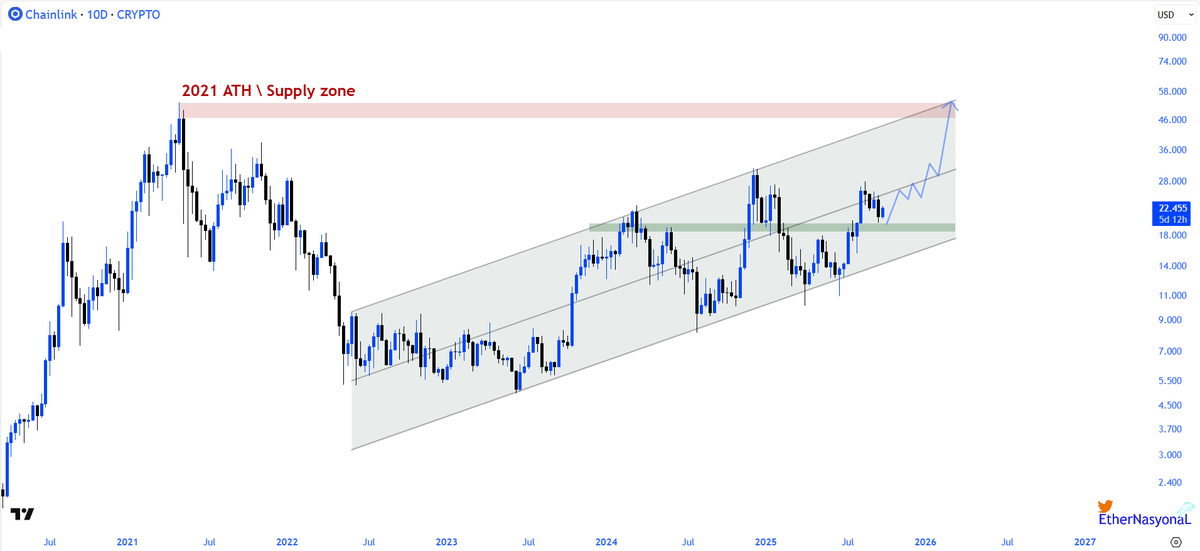
EtherNasyonaL pointed to LINK breaking above the middle band of the channel. The asset is now consolidating above this level, which has historically served as a pivot point for past moves.
If LINK holds above this band, the chart shows a possible move toward the upper boundary of the channel. The next heavy resistance remains the 2021 all-time high supply zone between $47 and $52. Support has firmed in the $18–$20 area after a successful retest.
Additionally, on-chain activity is also expanding. Martinez noted that 1,963 new addresses joined the network on October 1. Data from DeFi Llama reports that total value secured (TVS) in Chainlink has reached $66 billion, up from $25 billion in April this year.
Meanwhile, this increase in adoption strengthens Chainlink’s position in decentralized finance and may support higher price levels if momentum continues.
Short-Term Market Signals
LINK is trading near $22 on the 4-hour chart, where the EMAs 20, 50, 100, and 200 have converged. This tight cluster of moving averages marks an important decision zone, with a clear break above or below likely to set the next short-term direction.
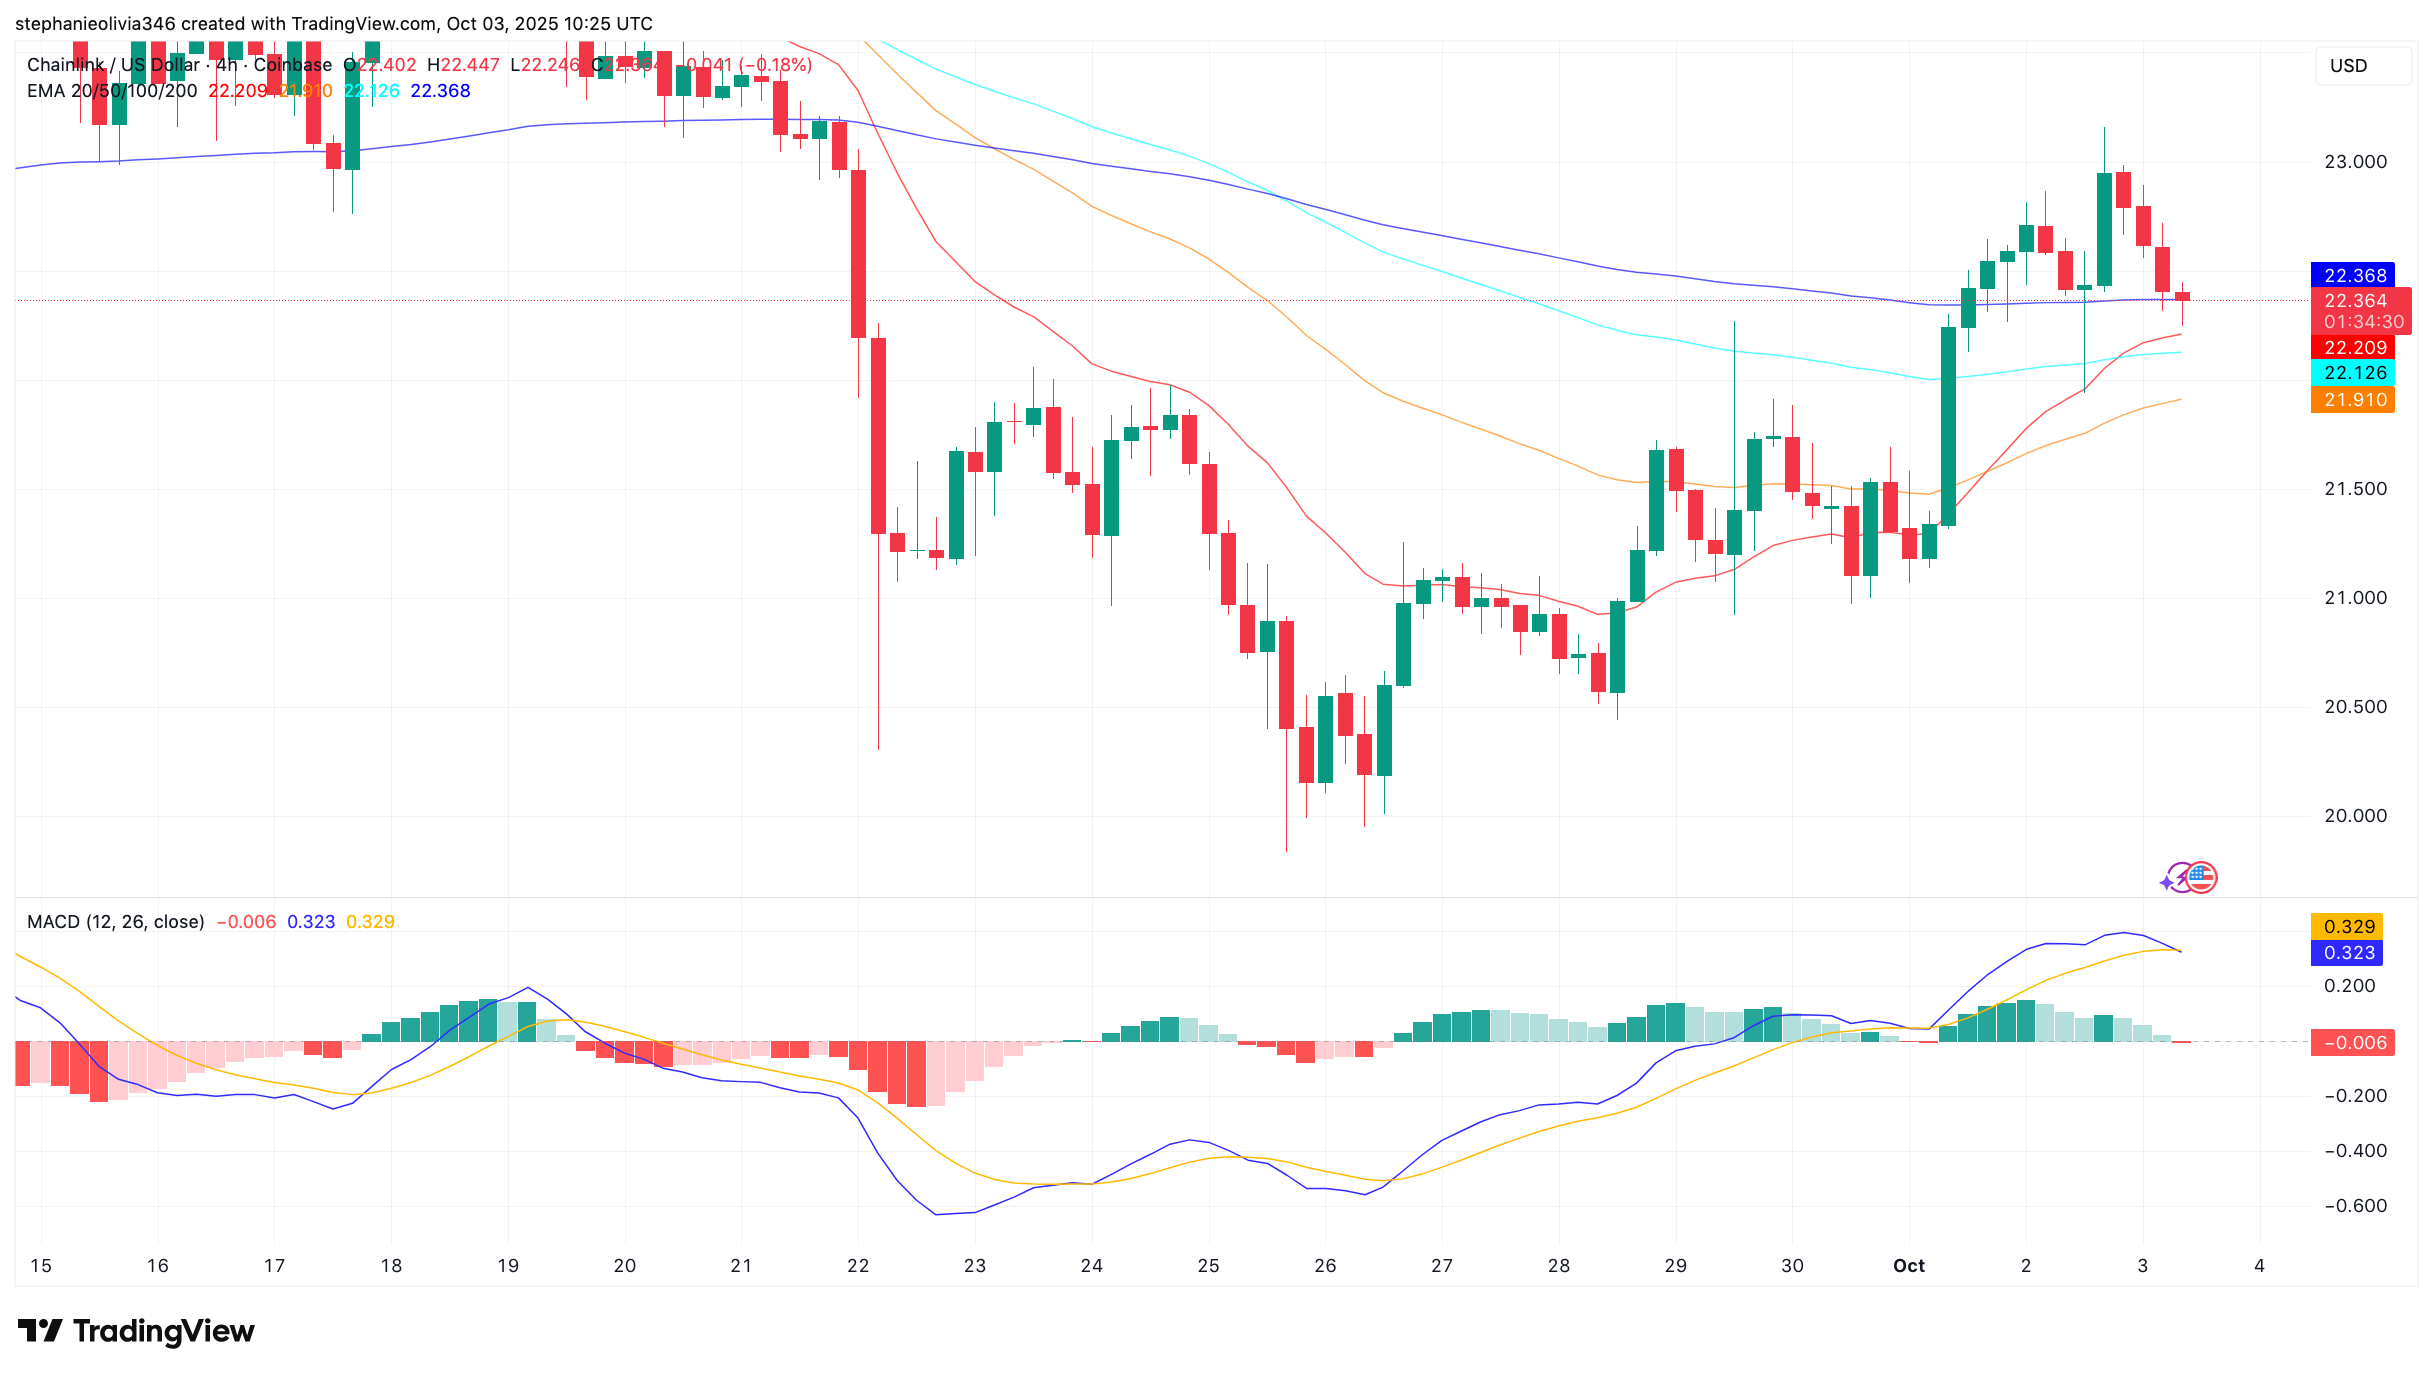
The MACD indicator has given a slight bearish crossover with a red histogram. The momentum is likely to lose its strength, indicating sideways movement or a pullback will be seen merely before another breakout attempt.
Outside of technical analysis, Chainlink continues to penetrate the real-world asset space, with partnerships involving global institutions such as Swift, DTCC, Euroclear, UBS, and BNP Paribas.
The post LINK Rally: Can Chainlink Break Toward $47 Soon? appeared first on CryptoPotato.
Chainlink (LINK) trades near $22 after a 10% weekly gain. Analysts track $47 targets as on-chain growth and technical signals support momentum. Crypto Bits, Crypto News, Chainlink (LINK) Price
This articles is written by : Nermeen Nabil Khear Abdelmalak
All rights reserved to : USAGOLDMIES . www.usagoldmines.com
You can Enjoy surfing our website categories and read more content in many fields you may like .
Why USAGoldMines ?
USAGoldMines is a comprehensive website offering the latest in financial, crypto, and technical news. With specialized sections for each category, it provides readers with up-to-date market insights, investment trends, and technological advancements, making it a valuable resource for investors and enthusiasts in the fast-paced financial world.