Passive investing has grown from a niche strategy into a core part of global financial markets. Index mutual funds and exchange-traded funds (ETFs) now hold trillions of dollars in stocks and bonds. In the United States, passive funds hold more assets than actively managed funds.
The global ETF industry is also at a record size. Worldwide ETF assets rose above $24 trillion for the first time in August 2026, after starting the year at about $19.85 trillion. Investors added nearly $2 trillion in net new money during the first eight months of the year.
Not all ETFs are passive. Actively managed ETFs are one of the fastest-growing parts of asset management and now hold about $2.6 trillion worldwide. Even so, traditional index investing remains the foundation of the industry.
Morningstar reports that assets in U.S. passive mutual funds and ETFs first passed those in active funds during 2024. The gap has kept widening since then. The reasons are lower costs, broad diversification and the difficulty active managers have in beating the market after fees.
This article uses data from the Investment Company Institute (ICI), Morningstar, ETFGI and S&P Dow Jones Indices. It covers assets, flows, ownership, performance and the rise of active ETFs.
Passive Investing Statistics at a Glance
The table below summarizes the main figures from the sources used in this article. Some numbers cover the whole fund industry, while others cover only ETFs or passive funds. The labels show which is which.
| Measure | Figure | Source |
|---|---|---|
| U.S. passive fund assets compared with active | Passive passed active during 2024 | Morningstar |
| Global ETF assets, August 2026 | $24.03 trillion | ETFGI |
| Global ETF assets, end of 2025 | $19.85 trillion | ETFGI |
| Global ETF net inflows, January to August 2026 | $1.96 trillion | ETFGI |
| Consecutive months of net ETF inflows by August | 88 | ETFGI |
| U.S. ETF assets, end of 2025 | $13.4 trillion | ICI |
| Number of U.S. ETFs, end of 2025 | 4,495 | ICI |
| U.S. households owning ETFs, 2025 | 19.8 million (15%) | ICI |
| Share of U.S. corporate equity held by U.S.-registered funds | 33% | ICI |
| Active large-cap funds trailing the S&P 500 in 2025 | 79% | S&P Dow Jones Indices |
| Active large-cap funds trailing the S&P 500 over 15 years | 90.5% | S&P Dow Jones Indices |
| Active ETF assets, July 2026 | $2.59 trillion | ETFGI |
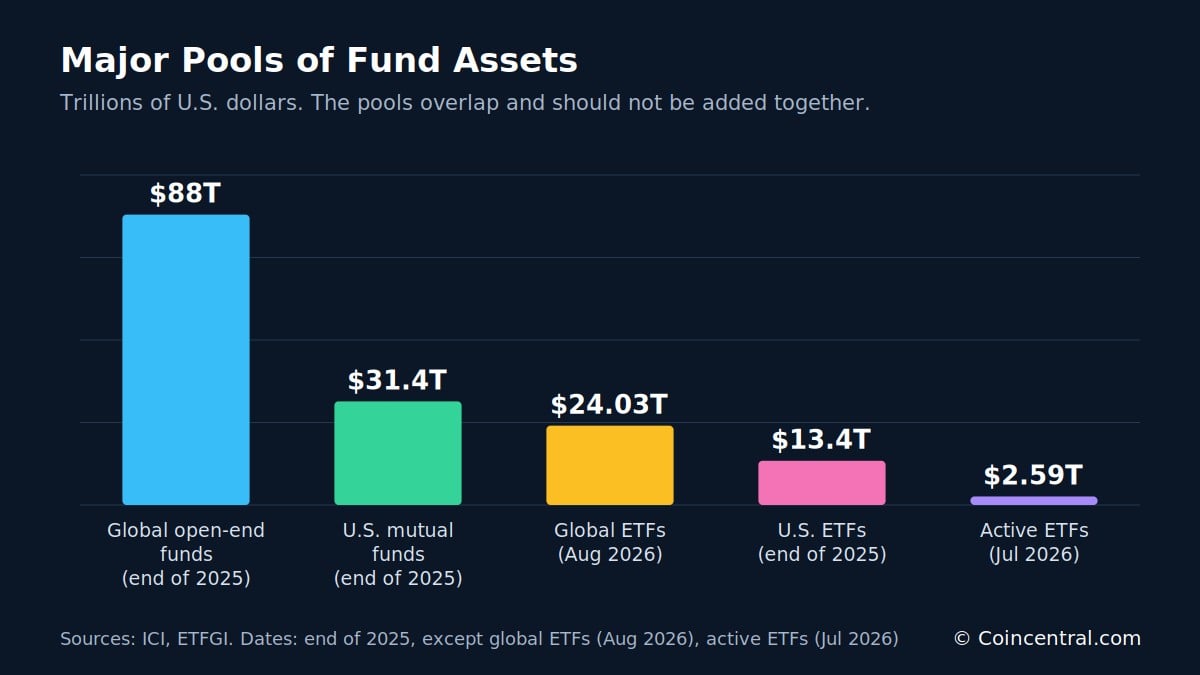
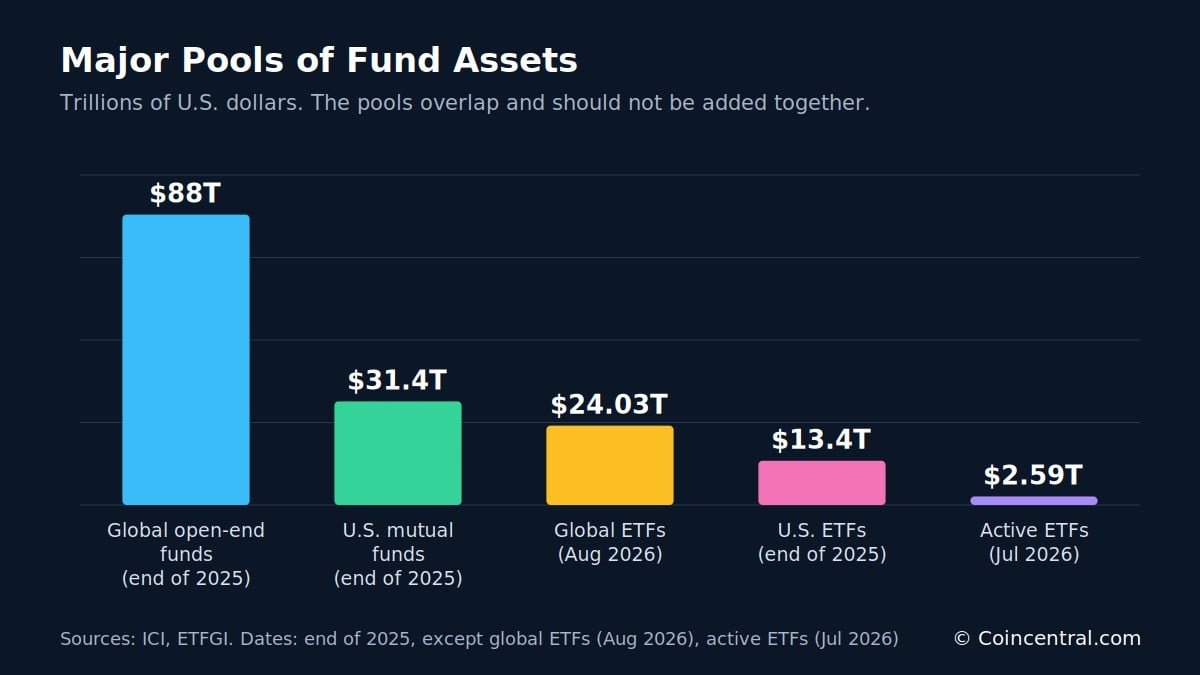
Taken together, the figures point to two trends. Passive funds keep gaining ground on active funds, and the ETF structure keeps growing for both passive and active strategies.
These trends are linked but not the same. The sections below treat them separately so the numbers are not mixed up.
Figure 1 shows the size of the main asset pools in the data. They overlap, so they should not be added together. U.S. ETFs, for example, are part of the global ETF total, and ETFs are part of the wider fund industry.
What Is Passive Investing and Why Do Investors Choose It?
Passive investing tries to match an index instead of beating the market. An index fund holds the securities in a benchmark, in about the same proportions as the benchmark itself.
An S&P 500 index fund is a simple example. When Apple, Microsoft or Nvidia becomes a larger share of the index, the fund automatically owns more of it. No portfolio manager decides whether a stock looks too expensive.
| Index | What it covers |
|---|---|
| S&P 500 | Large U.S. companies |
| Nasdaq-100 | Large companies listed on Nasdaq |
| MSCI World | Developed-market stocks |
| FTSE All-World | Stocks in developed and emerging markets |
| Russell 2000 | U.S. small-cap stocks |
| Bloomberg U.S. Aggregate | U.S. bonds |
Active investing works differently. A manager chooses securities and decides how much of each to hold, with the goal of beating a benchmark.
Passive funds come in two forms: index mutual funds and index ETFs. An ETF is a type of investment vehicle. Some ETFs are passive and others are actively managed.
Cost is the main advantage
The main economic advantage of passive funds is cost. A passive S&P 500 fund does not need large teams of analysts studying hundreds of companies. Some broad index products now charge only a few basis points a year.
Consider two hypothetical funds that each earn 8% a year before fees. One charges 0.05% a year and the other charges 1%. On a $10,000 investment over 30 years, the first grows to about $99,200 and the second to about $76,100.
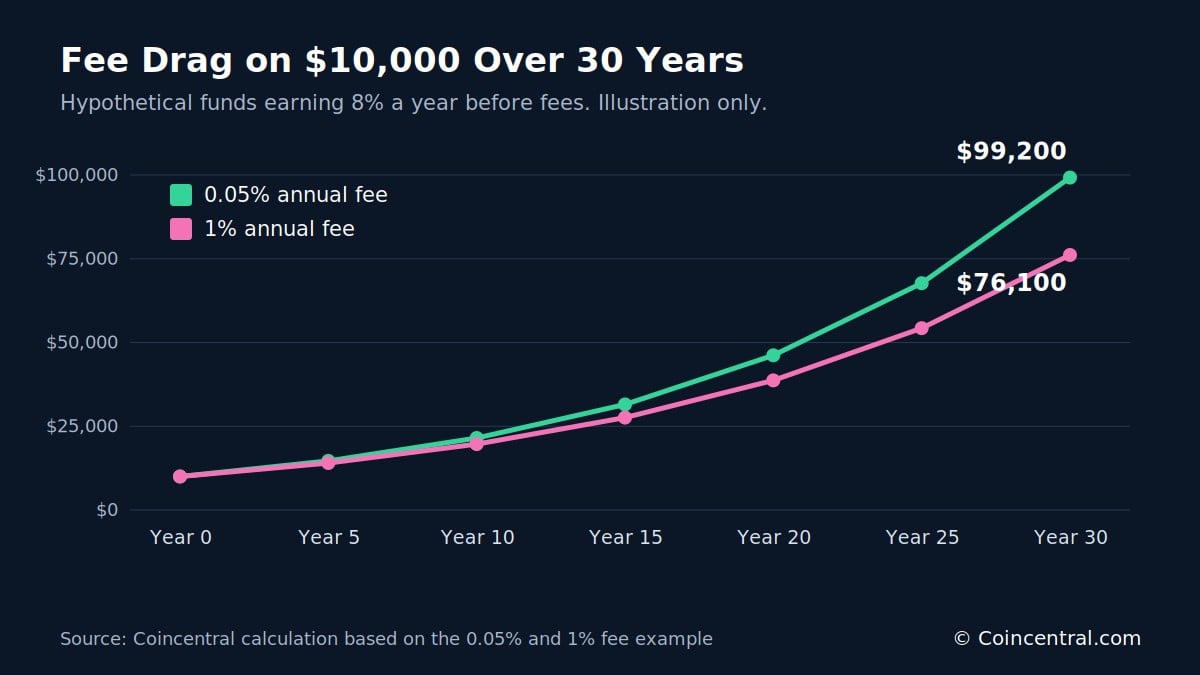
The gap is about $23,100, and it comes only from fees. The calculation assumes the net return compounds each year and ignores taxes.
Passive funds also start with a structural edge. A passive manager does not need to beat the market before costs just to match it after costs.
Global ETF Assets Have Passed $24 Trillion
ETF growth gives a clear picture of the shift. ETFGI reported worldwide ETF assets of $19.85 trillion at the end of 2025. By August 2026, the total was $24.03 trillion.
| Date | Global ETF assets |
|---|---|
| End of 2025 | $19.85 trillion |
| January 2026 | $20.64 trillion |
| February 2026 | $21.24 trillion |
| April 2026 | $21.91 trillion |
| May 2026 | $23.08 trillion |
| June 2026 | $23.09 trillion |
| July 2026 | $23.11 trillion |
| August 2026 | $24.03 trillion |
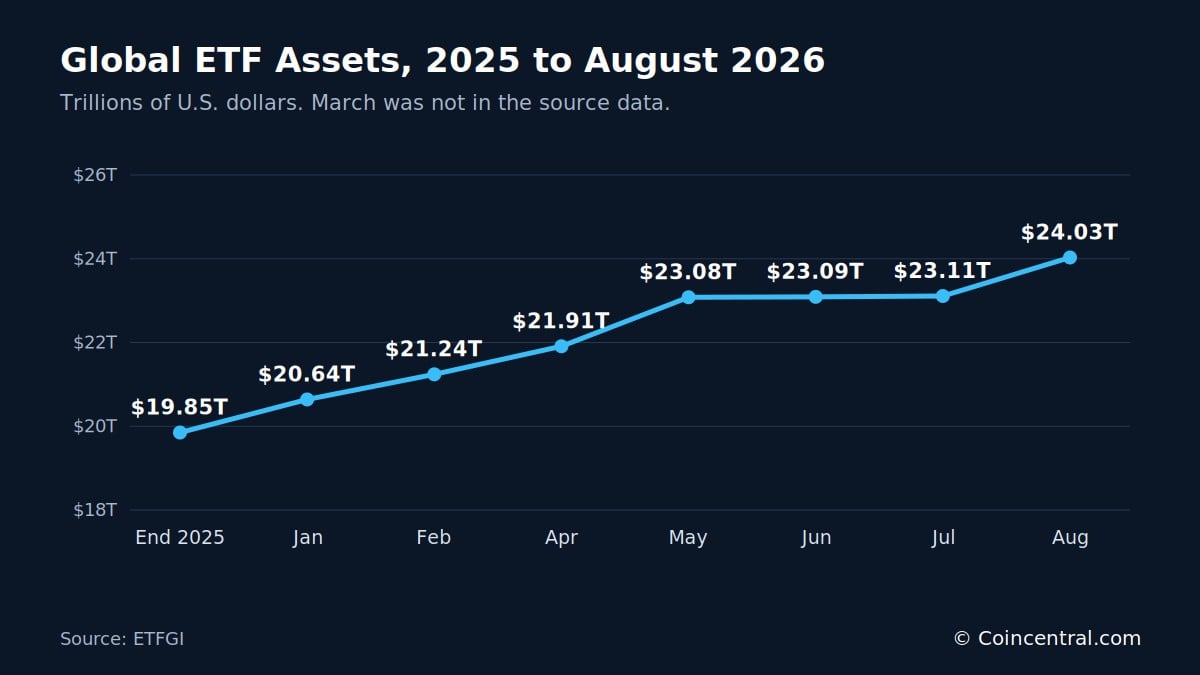
That is a gain of more than $4.1 trillion in eight months, or about 21%. It does not mean investors deposited that amount. Asset totals include net investor flows, stock market gains, bond market moves and currency changes.
The biggest jump in the data came in May, when assets rose from $21.91 trillion in April to $23.08 trillion. That is a gain of $1.17 trillion. The March figure was not in the source data, so the change between February and April cannot be split by month.
Growth was almost flat from May to July, with totals of $23.08 trillion, $23.09 trillion and $23.11 trillion. Then August added about $0.92 trillion.
Even with the market effects, investor demand was strong. The next section looks at flows alone.
ETF Inflows Are Close to $2 Trillion in 2026
Global ETFs took in about $1.96 trillion of net inflows through August 2026. The record for all of 2025 was $2.37 trillion. With four months left, 2026 had already reached about 83% of that record.
| Period (year to date) | Cumulative net inflows |
|---|---|
| February | $452 billion |
| April | $856 billion |
| May | $1.07 trillion |
| June | $1.33 trillion |
| July | $1.71 trillion |
| August | $1.96 trillion |
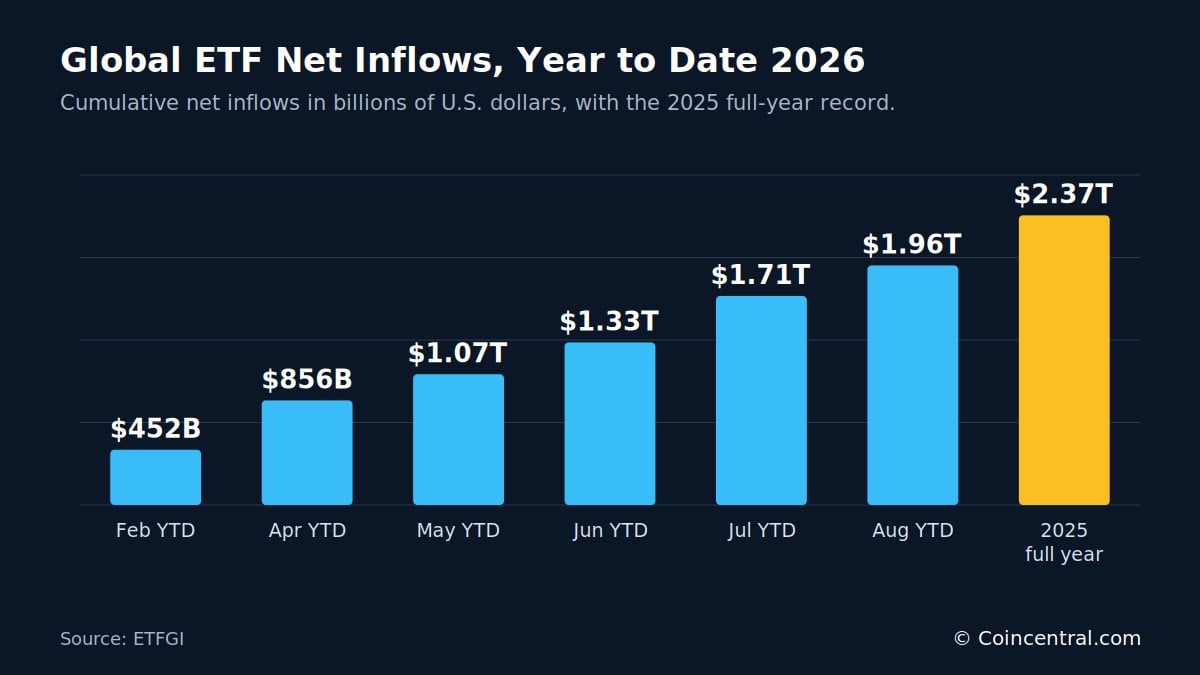
The pace picked up over the summer. Inflows grew by about $260 billion from May to June, by about $380 billion from June to July and by about $250 billion from July to August.
ETFs have also kept attracting money in volatile markets. The industry had recorded 88 consecutive months of net inflows by August 2026. That is more than seven years.
The U.S. ETF Market, Household Ownership and Retirement Accounts
The United States is the largest ETF market in the world. The ICI says U.S.-domiciled ETFs held about $13.4 trillion at the end of 2025, spread across 4,495 funds.
| U.S. investment company assets, end of 2025 | Amount |
|---|---|
| Mutual funds | $31.4 trillion |
| ETFs | $13.4 trillion |
| Total U.S.-registered investment companies | $45.1 trillion |
ETFs made up about 30% of assets managed by U.S. investment companies. Mutual funds remain larger, but ETFs have grown from a small product several decades ago into a major part of the regulated fund market.
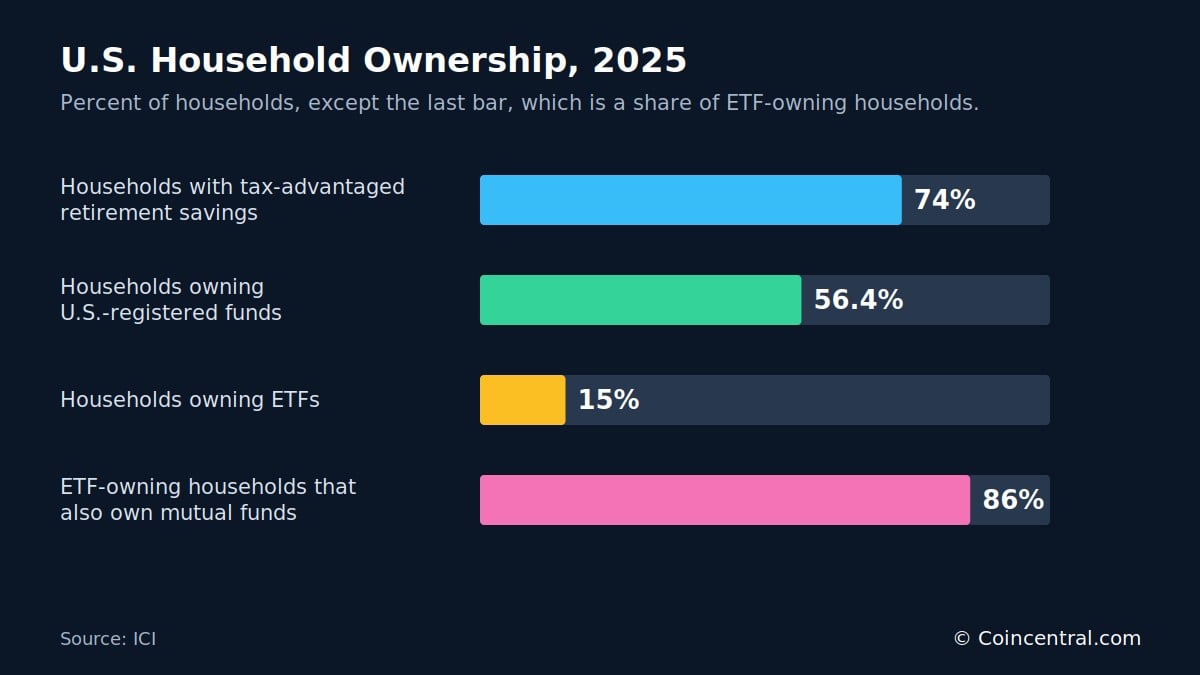
Ownership is spreading. The ICI estimates that 19.8 million U.S. households, about 15%, owned ETFs in 2025. About 86% of those households also owned mutual funds.
Fund ownership overall is much wider. About 76 million households, or 56.4%, owned U.S.-registered funds, and an estimated 128.7 million individuals owned them. ETF households therefore make up roughly one in four fund-owning households.
Retirement saving feeds passive growth
Retirement accounts help explain the growth of passive funds. U.S. retirement assets reached about $49.1 trillion at the end of 2025. About 74% of households had some form of tax-advantaged retirement savings.
Individual retirement accounts (IRAs) and defined-contribution plans such as 401(k)s made up about 68% of the retirement market. These accounts often use index funds, target-date funds, ETFs and passive bond funds.
Contributions arrive with every paycheck. That creates a steady flow of long-term money into investment funds.
How Much of the Stock Market Do Funds Own?
The ICI estimates that U.S.-registered investment companies owned about 33% of U.S. corporate equity at the end of 2025. They held smaller shares of other markets, as the table shows.
| Security type | Share held by investment companies |
|---|---|
| U.S. corporate equity | 33% |
| U.S. and foreign corporate bonds | 24% |
| Treasury and agency securities | 19% |
| Municipal securities | 29% |
| Commercial paper | 25% |
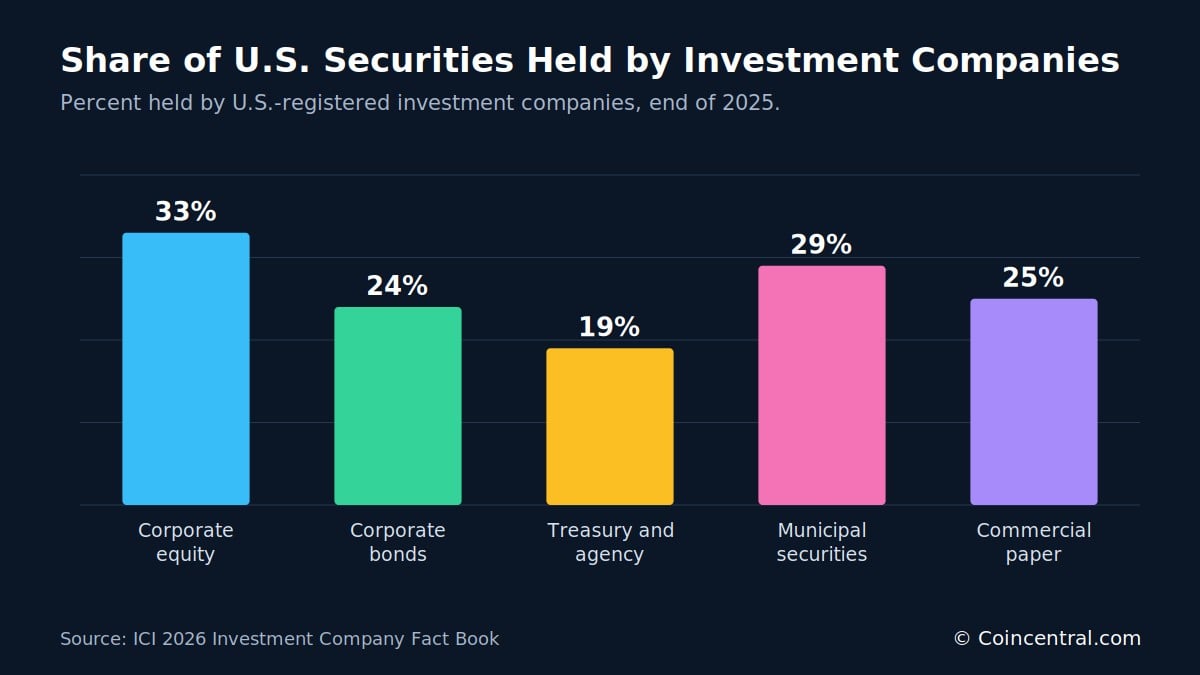
The 33% figure should not be described as passive funds owning one-third of the stock market. It includes both active and passive investment companies. The true passive share is smaller.
This matters because claims that index funds own half the stock market often mix up two measures. One is the passive share of fund assets. The other is the passive share of all corporate equity.
Debate over index effects
The rise of indexing has drawn criticism. A passive fund buys a stock because it is in an index, not because a manager thinks it is undervalued. Critics say this could reduce price discovery, send more money to the largest companies, raise market concentration, force trading around index changes and give large asset managers more voting influence.
These are legitimate research questions, but the evidence that passive investing has broken price discovery is disputed. Active investors still set prices at the margin by choosing what to buy and sell. Passive funds generally accept those prices.
Index changes can still move large sums. Reuters estimated that Strategy could face about $2.8 billion of passive-fund selling if MSCI removes it under proposed eligibility changes. A change in index rules can force buying or selling without any manager making a choice.
Most large index funds weight companies by market value. As a company’s value rises, its weight in the index rises too. U.S. stock returns have been concentrated in technology and AI-related companies, so these firms hold large weights.
Passive funds did not create those valuations. Index weights rose because investors across the market valued the companies more highly. Cause and effect run both ways, so it is hard to say index funds pushed prices up.
Most Active Large-Cap Funds Trail the S&P 500
The strongest case for passive investing comes from performance data. S&P Dow Jones Indices publishes the SPIVA reports, which compare active funds with their benchmarks.
In 2025, 79% of active U.S. large-cap equity funds underperformed the S&P 500. That is about eight in 10 funds. In the first half of 2026, the share fell to 67%, or about two in three.
| Period | Active large-cap funds that underperformed the S&P 500 |
|---|---|
| 2025 | 79% |
| First half of 2026 | 67% |
| Five years to June 2026 | 89.3% |
| 10 years to June 2026 | 83.3% |
| 15 years to June 2026 | 90.5% |
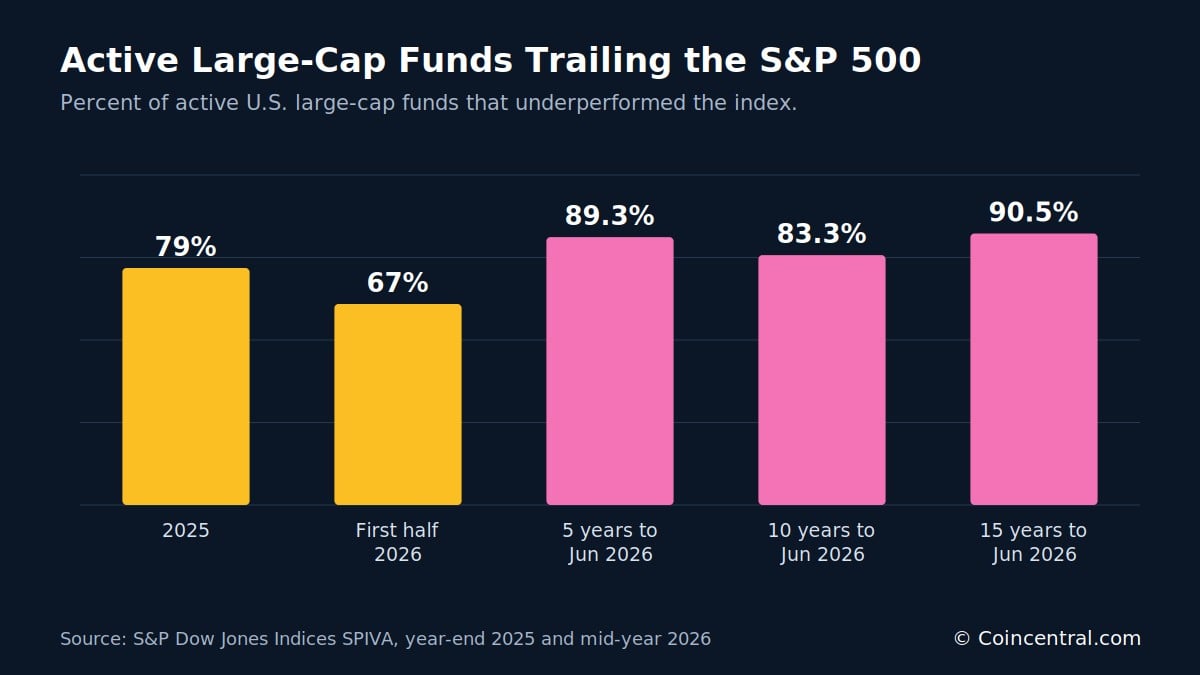
Long-term results are weaker for active managers. Through June 2026, 89.3% underperformed over five years, 83.3% over 10 years and 90.5% over 15 years. Over 15 years, that is about nine in 10 funds.
These figures do not mean that no active manager can win. They show that it is hard to pick the winners in advance.
Morningstar Data: One in Four Active Funds Wins Over 10 Years
Morningstar measures the question in a different way. Its Active/Passive Barometer compares active managers with passive funds in the same category, not only with an index.
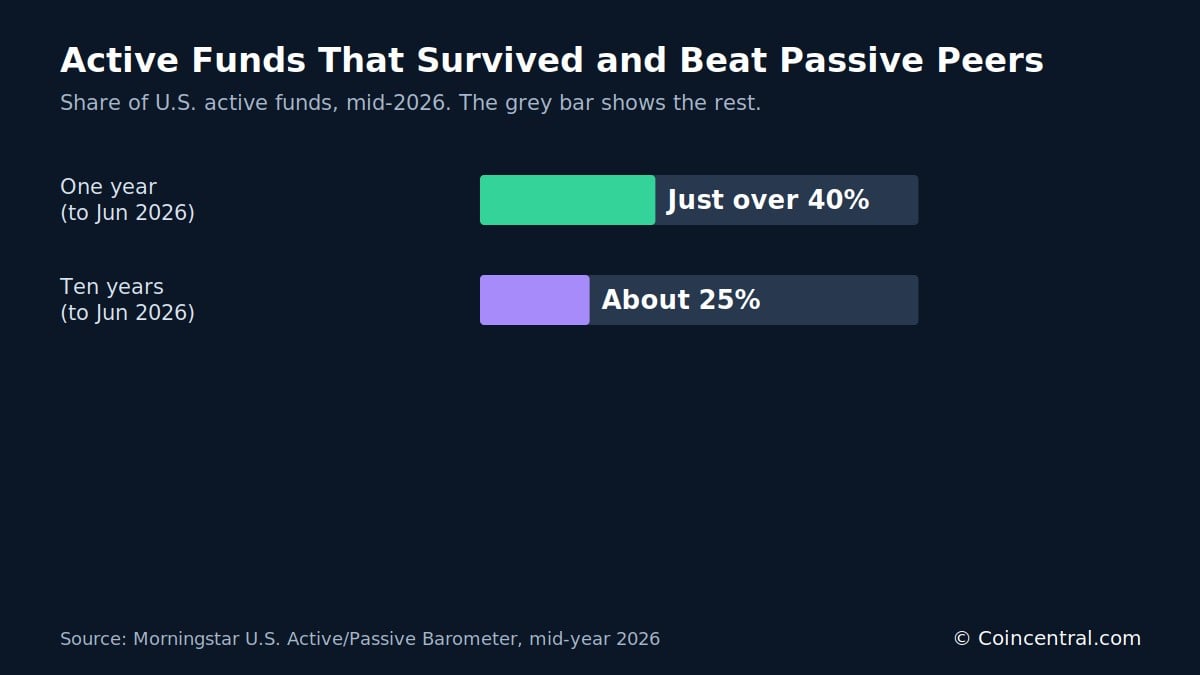
At mid-2026, its U.S. database covered 9,226 funds that held about $29 trillion. Slightly more than 40% of active funds survived and beat their passive peers over the past year. Over the decade to June 2026, only about 25% did.
| Period to June 2026 | Active funds that survived and beat passive peers |
|---|---|
| One year | Slightly more than 40% |
| Ten years | About 25% |
Fund closures matter in this kind of study. Poorly performing funds are often merged or shut down. A review of only the surviving funds can make active management look better than it was.
The Morningstar and SPIVA methods differ, but the results point the same way. The longer the period, the lower the share of active funds that beat low-cost alternatives.
Passive Funds Take Most New Equity Money
Fund flows show the shift in real time. Morningstar says passive strategies keep attracting the majority of new money across key U.S. asset classes, especially stocks. Active U.S. stock funds have seen steady outflows over the long term.
Europe shows a similar pattern. In the second quarter of 2026, passive equity funds took in €89.9 billion. Active equity funds lost €17.8 billion.
| European funds, Q2 2026 | Net flows |
|---|---|
| Passive equity funds | +€89.9 billion |
| Active equity funds | -€17.8 billion |
| All passive funds, all asset classes | +€128.5 billion |
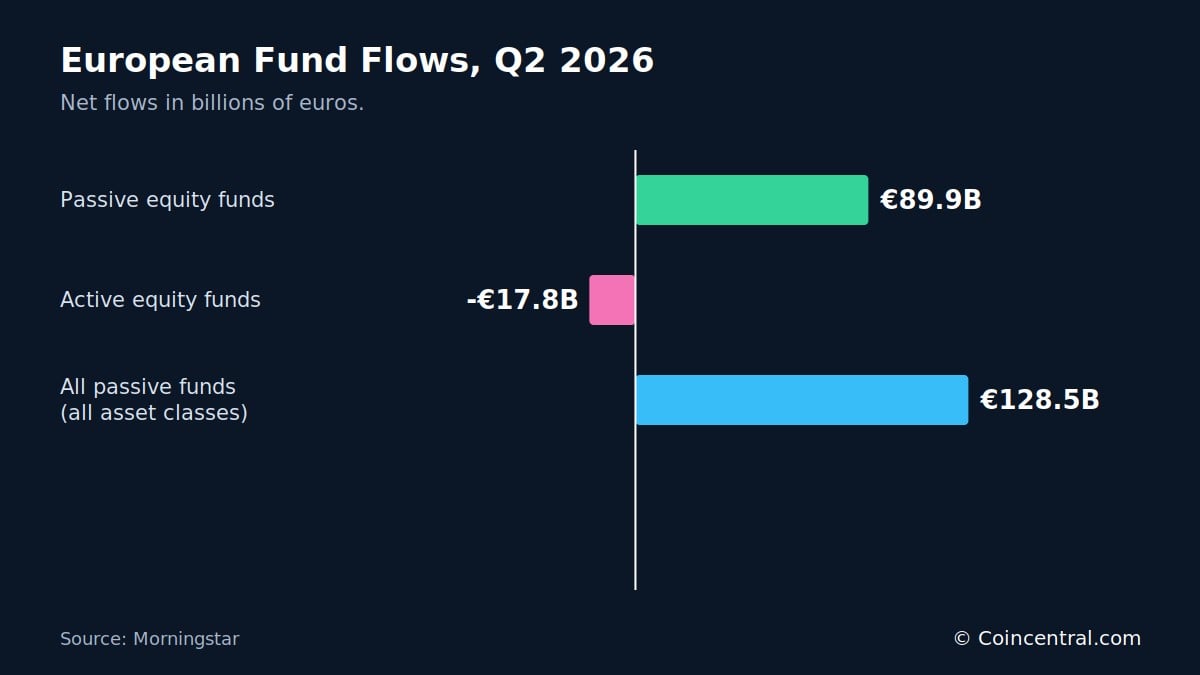
Across all asset classes, passive European funds drew about €128.5 billion in the quarter. The move toward passive funds is not only a U.S. trend.
Active ETFs Are Growing, and ETFs Are Not All Passive
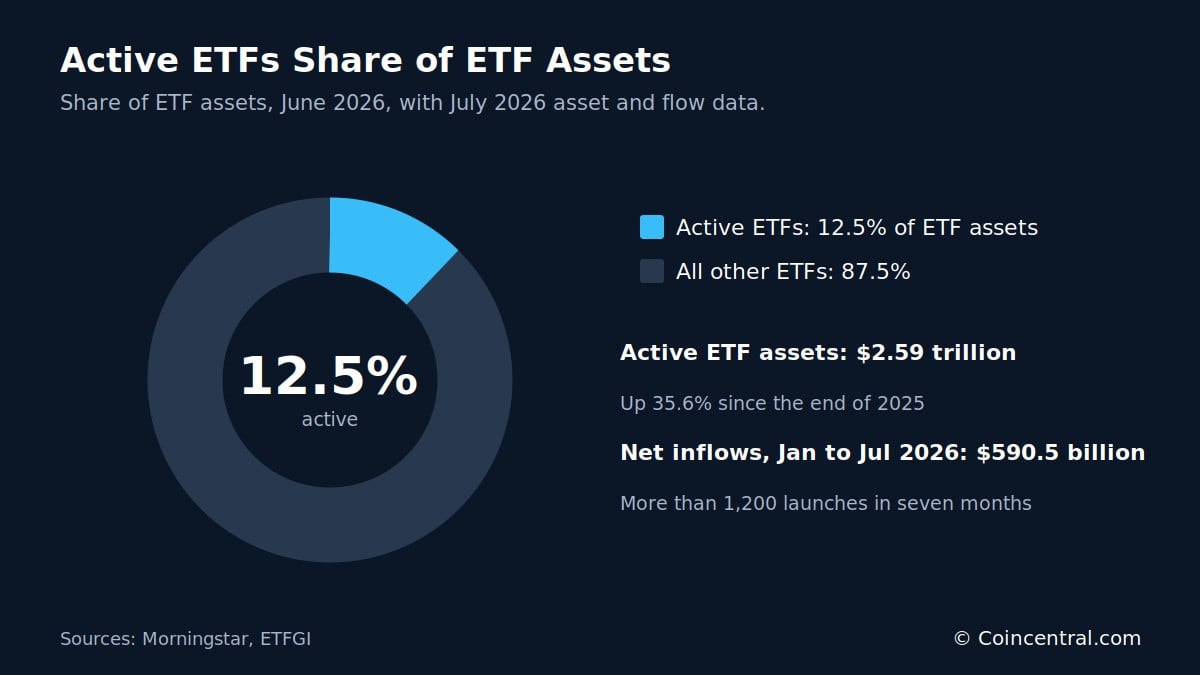
For years, ETF and passive investing were close to the same thing. That is no longer true. Morningstar reports that actively managed ETFs made up about 12.5% of all ETF assets in June 2026.
ETFGI measured worldwide active ETF assets at $2.59 trillion in July 2026. That was up 35.6% since the end of 2025, which implies a starting point of about $1.9 trillion. Active ETFs drew $590.5 billion of net inflows in the first seven months, already above any previous full year.
| Active ETF measure | Figure |
|---|---|
| Share of ETF assets, June 2026 | About 12.5% |
| Assets, July 2026 | $2.59 trillion |
| Change since end of 2025 | Up 35.6% |
| Net inflows, January to July 2026 | $590.5 billion |
| Launches, first seven months of 2026 | More than 1,200 |
Why investors like the ETF wrapper
Many investors like the ETF structure even when they want active management. ETFs can offer trading during the day, portfolio transparency, tax efficiency, lower operating costs, easy brokerage access and no traditional mutual fund minimums.
Asset managers have responded with active equity ETFs, bond ETFs, options strategies, income strategies, buffer ETFs and thematic funds. ETFGI counted more than 1,200 active ETF launches worldwide in the first seven months of 2026.
The debate is now partly passive versus active and partly ETF versus mutual fund. Passive funds still hold most of the assets, but active strategies are moving into the ETF wrapper. Some investors may pair low-cost core passive holdings with specialized active strategies.
The Bottom Line
Passive investing is now a central part of modern finance. U.S. passive mutual funds and ETFs passed active funds by assets during 2024, and the gap has kept growing.
Global ETF assets grew from about $19.85 trillion at the end of 2025 to more than $24 trillion by August 2026. Nearly $2 trillion of net new money entered ETFs in those eight months.
In the United States, ETFs hold about $13.4 trillion and 19.8 million households own them. The wider fund industry owns about one-third of U.S. corporate equities, a figure that includes both passive and active funds.
Performance data explains much of the shift. About 79% of active U.S. large-cap funds trailed the S&P 500 in 2025, and about 90% trailed it over 15 years. Morningstar finds that only about one in four active funds survived and beat passive peers over the decade to June 2026.
The next question is less about whether passive investing keeps growing and more about its effects. Large pools of money that track indexes may influence fees, competition, corporate ownership, market concentration and price discovery. Active ETFs add another change, since the ETF label no longer means passive.
Sources
- Investment Company Institute: 2026 Investment Company Fact Book
- ICI: U.S. ETF Market FAQs, April 2026
- Morningstar: U.S. Active/Passive Barometer, Mid-Year 2026
- Morningstar: Active vs. Passive Investing
- Morningstar: State of U.S. ETFs in 2026
- ETFGI: Global ETF Industry, August 2026
- ETFGI: Global ETF Industry 2025
- ETFGI: Global Active ETF Industry, July 2026
- S&P Dow Jones Indices: SPIVA U.S. Year-End 2025
- S&P Dow Jones Indices: SPIVA U.S. Mid-Year 2026
The post Passive Investing Statistics 2026: Index Funds, ETFs and Market Share appeared first on Blockonomi.
This articles is written by : Nermeen Nabil Khear Abdelmalak
All rights reserved to : USAGOLDMIES . www.usagoldmines.com
You can Enjoy surfing our website categories and read more content in many fields you may like .
Why USAGoldMines ?
USAGoldMines is a comprehensive website offering the latest in financial, crypto, and technical news. With specialized sections for each category, it provides readers with up-to-date market insights, investment trends, and technological advancements, making it a valuable resource for investors and enthusiasts in the fast-paced financial world.