
TLDR:
- XRP’s SuperTrend indicator flipped bullish on the daily chart for the first time since January 17, 2025.
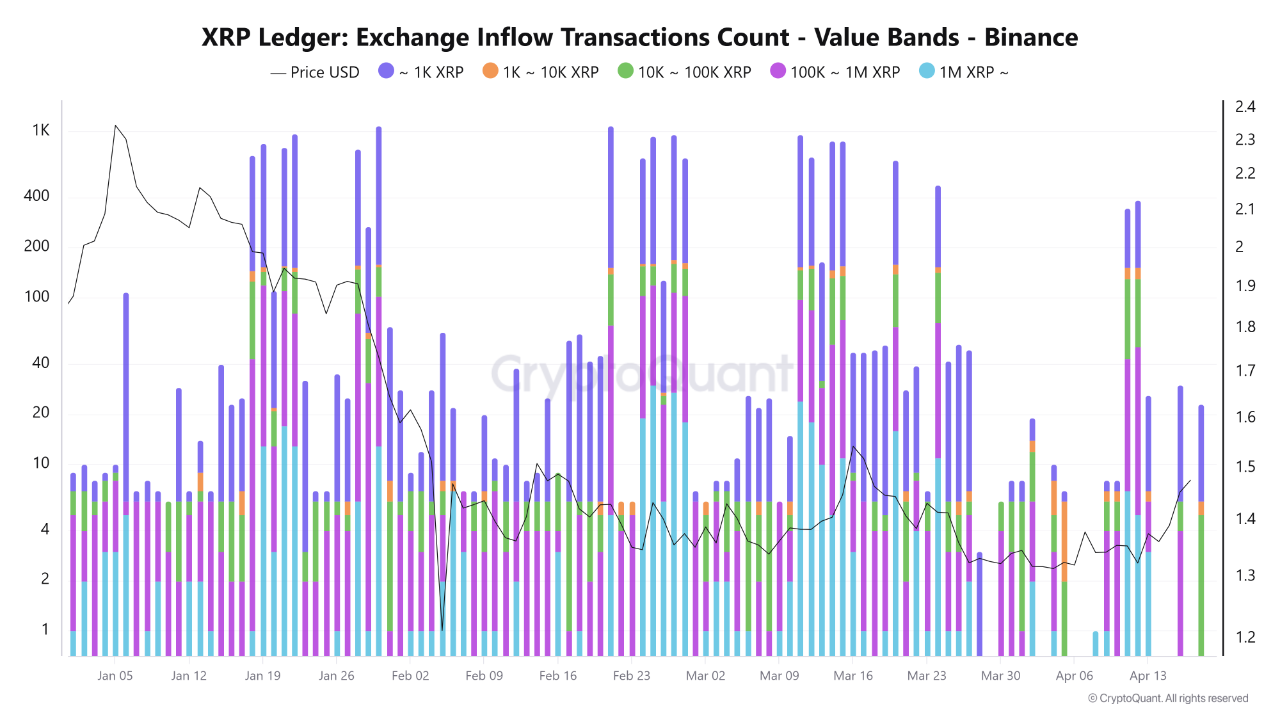
- Transfers above 100K and 1M XRP show periodic spikes but lack consistency, signaling no clear whale direction.
- No strong correlation exists between XRP inflows and price, pointing to balanced liquidity absorbing supply.
- A daily close above $1.55 resistance could trigger a relief rally toward the primary target zone of $1.90.
XRP price is drawing attention as fresh technical and on-chain data point toward a potential trend reversal. At $1.43, the asset’s SuperTrend indicator has flipped bullish on the daily chart for the first time since January 17.
Meanwhile, on-chain transfer data shows balanced liquidity conditions across the market. Analysts are now watching key resistance levels closely.
The broader setup suggests that a sustained push from spot buyers could trigger a sharp upward move in price.
On-Chain Data Points to Balanced Liquidity Across XRP Market
Retail activity remains visible in the XRP network, particularly through transfers in the 10,000 to 100,000 XRP range.
Source: Cryptoquant
However, this type of inflow primarily generates trading volume rather than direct price movement. Transfers at this scale carry a neutral effect on price direction overall.
Larger transfers, those above 100,000 and one million XRP, have shown periodic spikes in activity. Yet the pattern remains inconsistent, meaning whale participants are not applying steady directional pressure. The market, as a result, lacks a clear dominant force at the upper transfer tiers.
Notably, there is no reliable correlation between inflow volume and price movement in either direction. When inflows rise, the price does not automatically fall. When inflows slow, the price does not automatically climb either.
This pattern suggests that incoming coins are not all being sold into the market at once. Sufficient liquidity appears to be absorbing available supply.
Based on this data, the main price drivers are likely derivatives market activity and the broader market trend rather than spot inflows.
SuperTrend Flip Puts XRP Resistance Level of $1.55 in Focus
Crypto analyst Ali Charts noted on social media that XRP’s SuperTrend indicator has turned bullish on the daily chart.
This is the first such signal since January 17, ending an extended period of sell pressure across the chart. The shift marks a notable change in short-term trend structure for the asset.
The real test, however, remains at the $1.55 resistance level. That price zone has repeatedly capped upward movement in recent weeks. A clean daily close above $1.55 would likely open the door to a broader relief rally.
With the SuperTrend now acting as a trailing support floor, the primary target for any sustained move sits at the $1.90 zone. Traders are watching that level as the next meaningful objective should buying pressure increase.
On-chain conditions currently show no strong selling pressure in the market. Liquidity remains stable, and inflows alone are not dominating price action. If spot buying strengthens from here, XRP could move sharply higher in the near term.
The post XRP Price Waits for Buyers as SuperTrend Flips Bullish and Liquidity Holds Steady appeared first on Blockonomi.
This articles is written by : Nermeen Nabil Khear Abdelmalak
All rights reserved to : USAGOLDMIES . www.usagoldmines.com
You can Enjoy surfing our website categories and read more content in many fields you may like .
Why USAGoldMines ?
USAGoldMines is a comprehensive website offering the latest in financial, crypto, and technical news. With specialized sections for each category, it provides readers with up-to-date market insights, investment trends, and technological advancements, making it a valuable resource for investors and enthusiasts in the fast-paced financial world.